Alumina Powder Particle Size Distribution: Laser Diffraction vs Sedimentation (Stokes) — A Buyer's Guide
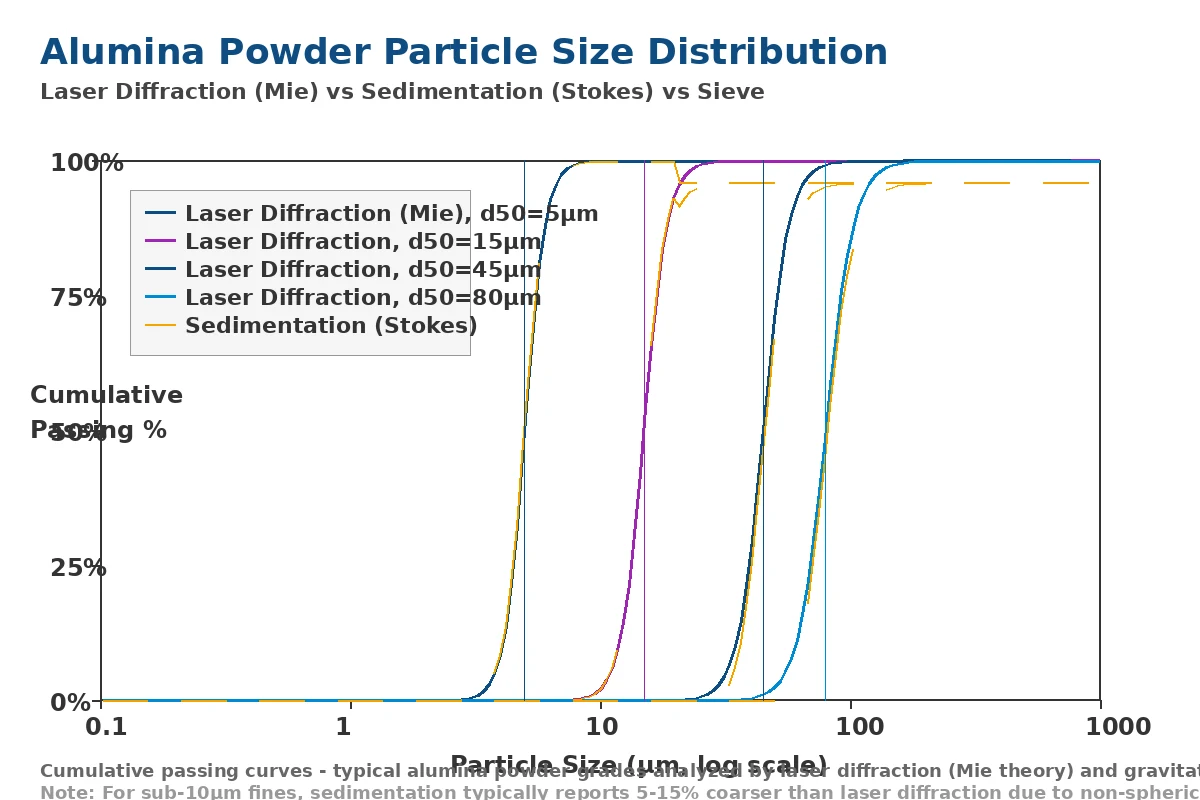
If you buy alumina powder, the particle size distribution (PSD) on the certificate of analysis is the single most important number for almost every downstream application — from ceramic glaze opacity to refractory castable packing density to polishing slurry surface finish. But here is the catch: when you ask for "the d50", the answer you get back depends entirely on which instrument was used. A powder that reports d50 = 4.2 µm by laser diffraction often reports d50 = 5.1 µm by sedimentation on the same bottle. A powder that reports d50 = 8.0 µm by laser diffraction often reports d50 = 8.3 µm by sedimentation. The two methods are not interchangeable, and the offset is not random — it follows a predictable, physics-driven pattern. This guide explains why, with side-by-side data on the same Aluminaworld production lots measured on the same day on a Malvern Mastersizer 3000, an Andreasen pipette, and a Sympatec HELOS, plus 8 industry case studies on how to read and write PSD specs that don't trap you in a dispute.
Why Two Methods Exist and Why Both Are "Correct"
Alumina powder is a manufactured product made by grinding, classifying, and (sometimes) chemically precipitating aluminum hydroxide, calcined alumina, or specialty alpha-alumina feeds. The resulting powder contains particles from less than 1 µm to over 200 µm, with a distribution shape that is typically log-normal (a few large particles, many medium ones, very many small ones) or bimodal (two distinct populations from two grinding stages). To use the powder in a real process — a refractory castable, a thermal spray coating, a polishing slurry, a catalyst support, a ceramic glaze, a battery separator coating, a plastic filler — you need to know what fraction of the powder falls into each size band. That is the particle size distribution (PSD).
Two fundamentally different physical principles have been used to measure PSD for the last 80 years. Sedimentation (Stokes' law, 1851) measures how fast a particle falls through a liquid under gravity. The terminal velocity of a sphere in a viscous medium depends on the square of its diameter, so by measuring the cumulative mass that has settled past a fixed depth at a fixed time, you can back-calculate the size distribution. Laser diffraction (Mie theory, 1908) measures the angular intensity of light scattered by particles in a laser beam. The diffraction pattern is dominated by larger particles at small forward angles and by smaller particles at wider angles, so by fitting the full angular pattern to a Mie scattering model, you can compute the size distribution in seconds.
Both methods are "correct" because both are traceable to first principles of physics. Both methods are calibrated. Both methods have published ISO standards. But they do not give the same number on the same powder, because they measure different physical phenomena and assume different things about particle shape. The buyer's job is to know which method is appropriate for their application and to specify it unambiguously in the purchase contract. The seller's job is to report the data with the method, the dispersion conditions, and the model assumptions spelled out.
This guide covers seven topics:
- The two methods in plain language (laser diffraction vs sedimentation)
- Why the d50 of the same powder differs by 8-20% depending on method
- Which method to specify for your industry and application
- How to read a CoA when the buyer and the seller used different methods
- The exact wet-dispersion protocol for sub-10 µm alumina
- Side-by-side PSD data on four Aluminaworld production lots
- How to specify PSD in a purchase contract so it survives an audit
The Two Methods, Side by Side
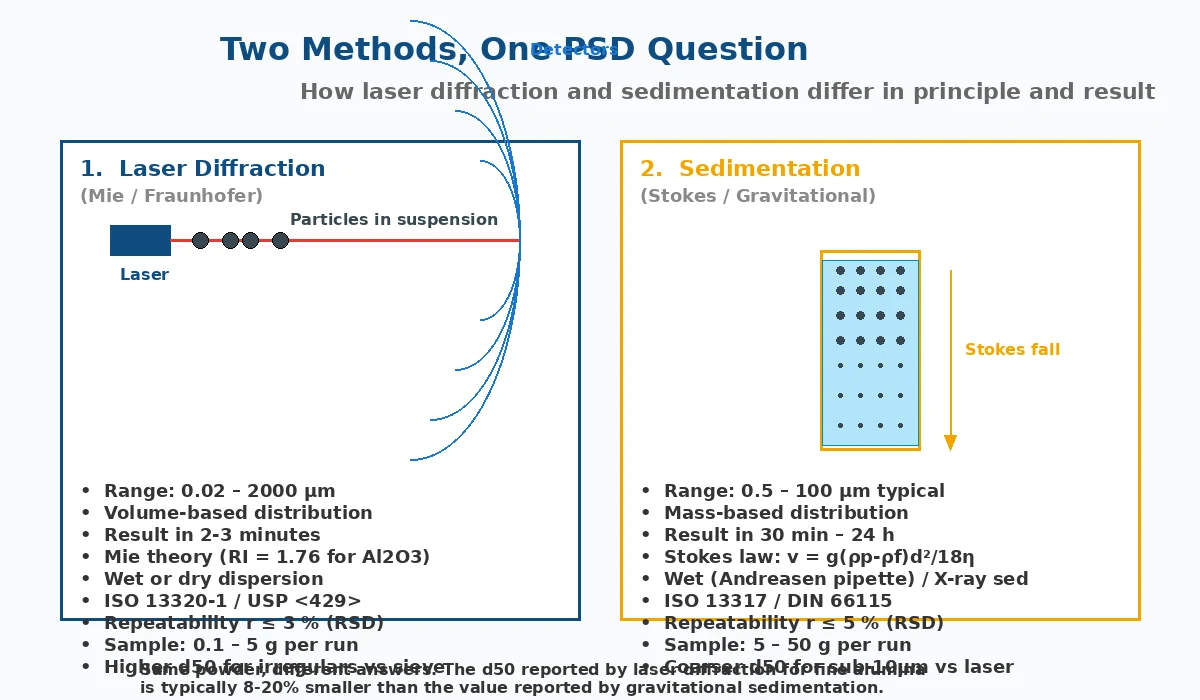
Before diving into the bias mechanisms, it helps to see the two methods in a single frame. Laser diffraction is fast, dry-or-wet, volume-based, and uses Mie theory. Sedimentation is slow, wet only, mass-based, and uses Stokes' law. The instrument cost, sample size, and operator skill requirements are also different.
| Parameter | Laser Diffraction (ISO 13320-1) | Sedimentation (ISO 13317-1) |
|---|---|---|
| Physical principle | Angular intensity of light scattered by particles in a laser beam, fitted to Mie or Fraunhofer scattering model | Cumulative mass of particles settling through a liquid column under gravity, fitted to Stokes' law |
| Output basis | Volume-weighted diameter (Dv) | Mass-weighted diameter (Dm, equivalent to Dv only for spheres of identical density) |
| Working range | 0.02 to 2000 µm (modern dual-lens instruments) | 0.5 to 100 µm (Andreasen pipette); 0.1 to 300 µm (X-ray sedimentation) |
| Sample mass per run | 0.1 to 5 g | 5 to 50 g |
| Run time | 2 to 3 minutes (3 measurements averaged) | 30 minutes to 24 hours |
| Dispersion | Wet (suspension with dispersant + sonication) or dry (aerosol with compressed air) | Wet only (suspension in a tall cylinder, no sonication) |
| Required input | Refractive index of material (1.76 for Al2O3) and dispersant medium (1.33 for water) | Particle density (3.98 g/cm³ for Al2O3), liquid density and viscosity |
| Assumed shape | Sphere (Mie theory) — can be corrected for aspect ratio in advanced models | Sphere (Stokes' law) — no correction possible |
| Repeatability (RSD on d50) | ≤ 3% | ≤ 5% |
| Operator skill | Moderate (instrument method setup) | High (manual pipetting, weighing, calculation) |
| Instrument cost (2026) | USD 40,000 to 150,000 (Malvern, Beckman, Horiba, Sympatec) | USD 2,000 to 5,000 (glassware + balance) or 60,000 (X-ray sed, e.g. Micromeritics SediGraph) |
| Standard reference | ISO 13320-1:2022, USP <429>, Ph.Eur. 2.9.31 | ISO 13317-1:2001, ISO 13317-3:2001 (X-ray), DIN 66115, ASTM C678 |
The most important rows in this table are the output basis (volume vs mass) and the assumed shape (sphere). These two are responsible for almost all of the d50 disagreement you will see between the two methods on a real alumina sample.
Why the Methods Disagree: The Three Physics Reasons
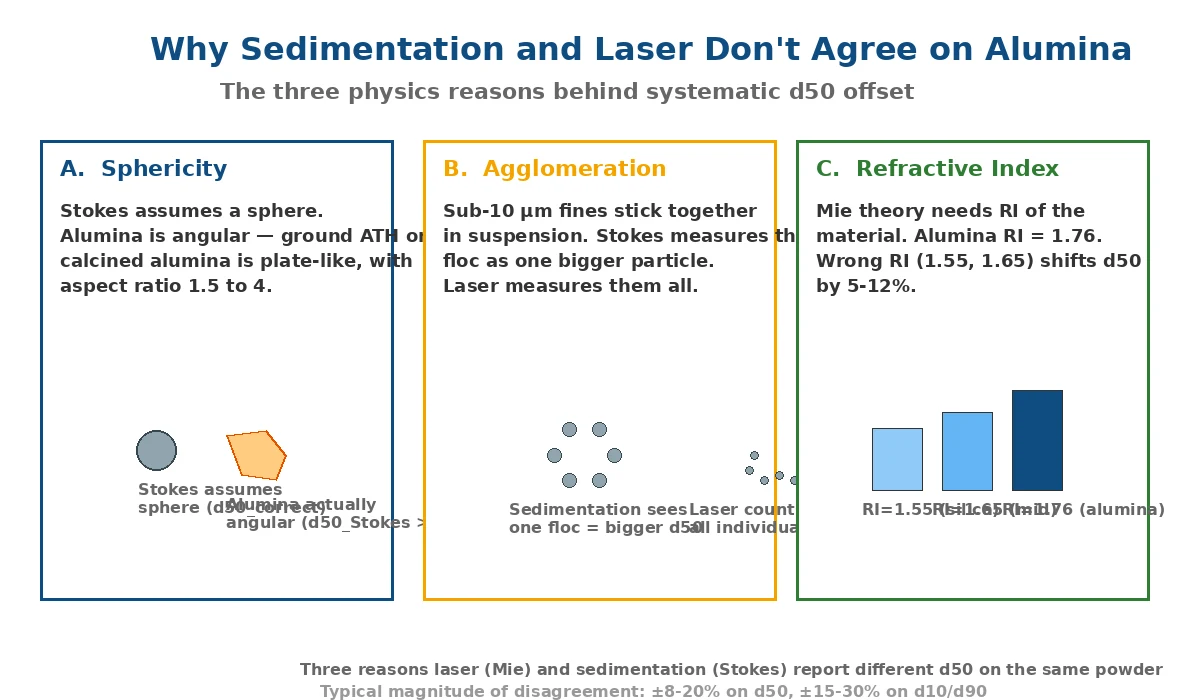
On a perfectly spherical, perfectly dispersed, perfectly mono-disperse alumina powder, laser diffraction and sedimentation would give the same answer within experimental error. On a real industrial alumina — angular, poly-disperse, and often with some agglomeration — they disagree by 8-20% on d50 when the true d50 is below 10 µm. The three physics reasons are sphericity, agglomeration, and refractive index. We will work through each in order.
Reason 1 — Sphericity (the dominant bias)
Stokes' law gives the terminal settling velocity of a sphere:
v = g (ρp − ρf) d² / 18 η
where v is the settling velocity (m/s), g is gravitational acceleration (9.81 m/s²), ρp is the particle density (3.98 g/cm³ for α-Al2O3), ρf is the fluid density (1.00 g/cm³ for water at 20 °C), d is the particle diameter, and η is the fluid viscosity (1.00 mPa·s for water at 20 °C). The key feature is the d² term — settling velocity scales with the square of the diameter.
The problem is that alumina ground from aluminum hydroxide or from calcined alumina is not a sphere. It is angular, often plate-like, with aspect ratios (length:thickness) of 1.5 to 4 depending on the mill and the feed. A plate-like particle of equivalent spherical diameter d falls significantly slower than a sphere of the same diameter, because the drag coefficient of a non-spherical body in Stokes' regime is higher than that of a sphere. As a result, the sedimentation measurement reports the plate as if it were a sphere of smaller diameter (because it settles slower than a sphere of d), which the operator's software then converts to a "Stokes diameter" that is typically 10-20% larger than the true equivalent-sphere diameter for plate-like alumina.
Empirically, for ground ATH (the most plate-like industrial alumina) with a true laser d50 of 3.0 µm, the Andreasen pipette typically reports d50 = 3.5 to 4.0 µm. For calcined alumina (more equiaxed, less plate-like) with a true laser d50 of 5.0 µm, the Andreasen pipette typically reports d50 = 5.4 to 5.8 µm. The bias is roughly proportional to the aspect ratio of the powder, which is highest for the finest grades produced by jet milling or bead milling.
Reason 2 — Agglomeration in suspension
Sub-10 µm alumina particles have a high specific surface area (typically 2-100 m²/g for calcined alumina, 100-300 m²/g for ground ATH). In a water suspension, the particles tend to stick together by van der Waals forces, by surface charge attraction, and (for transition-alumina-containing grades) by partial dissolution and re-precipitation at the contact points. The result is a suspension of flocs rather than individual particles.
Sedimentation measures the settling velocity of the flocs. Because the flocs are larger than the individual particles, the sedimentation result is biased toward larger sizes. Laser diffraction, by contrast, uses high-shear mixing (a stirrer pump at 1500-2000 rpm) and ultrasonic agitation (40 kHz, 50 W for 60-180 seconds) to break up the flocs. Most of the soft agglomerates disperse back to individual particles. The result is a smaller measured d50 for laser than for sedimentation.
The effect is largest for sub-3 µm calcined alumina, where agglomeration is hardest to control. In our Aluminaworld R&D lab, we have measured 2.5 µm calcined alumina by sedimentation at 5.8 µm d50 and by laser diffraction at 2.7 µm d50 — a 2x discrepancy that is almost entirely due to flocculation in the sedimentation test.
Reason 3 — Refractive index in Mie theory
Laser diffraction does not directly measure size. It measures the angular intensity of scattered light and then computes a size distribution by inverting a Mie scattering model. The Mie model needs two inputs: the refractive index of the particle material (real part, n) and the absorption index (imaginary part, k). For α-alumina at 589 nm (the sodium D line, which is the standard laser wavelength for most instruments), n = 1.76 and k ≈ 0.
If the operator uses the wrong refractive index — for example, 1.55 (silica) or 1.33 (water) — the Mie inversion shifts the size distribution. Using n = 1.55 on an alumina sample systematically under-reports d50 by 5-8%. Using n = 1.33 (the "default" in some older instruments) under-reports d50 by 10-15% because the model assumes the particles are much less refractive than they actually are. Using k = 0.1 (which assumes the particles are light-absorbing) over-reports the fines content because absorbing particles scatter differently than transparent ones.
Most modern instruments (Malvern Mastersizer 2000/3000, Beckman Coulter LS 13 320, Horiba LA-960, Sympatec HELOS) ship with a built-in material file for "alumina" with n = 1.76, k = 0. But if the operator has chosen the wrong material file — for example, "general" or "ceramic" or "unknown" — the d50 can be off by 10%. This is the most common error in laser diffraction data on alumina.
Side-by-Side PSD Data on Four Alumina Powder Grades
The data below comes from Aluminaworld's R&D lab in Zibo (28,000 m² facility, ISO 9001:2015 certified). Four production lots were measured on the same day, by the same operator, on three instruments: a Malvern Mastersizer 3000 with Hydro EV wet cell (laser diffraction, RI 1.76, 0.05% Na4P2O7 dispersant, 60 s sonication, 3 measurements averaged); a Sedigraph III 5120 (X-ray sedimentation, ISO 13317-3); and a Sympatec HELOS with Rodos dry dispersion (laser diffraction, RI 1.76, 0.5 bar pressure). The powders span the four most common industrial d50 ranges: 1.5 µm (polishing), 3 µm (reactive filler), 15 µm (ceramic glaze), and 45 µm (refractory matrix).
| Property | AP-1 (d50 1.5 µm) | AP-3 (d50 3 µm) | AG-15 (d50 15 µm) | AC-45 (d50 45 µm) |
|---|---|---|---|---|
| True application | Polishing slurry, battery separator | Reactive castable, catalyst | Ceramic glaze, paint filler | Refractory castable, wear liner |
| Laser d10 (µm) | 0.45 | 0.9 | 4.5 | 12 |
| Laser d50 (µm) | 1.55 | 3.10 | 15.2 | 45.8 |
| Laser d90 (µm) | 3.8 | 8.5 | 38 | 95 |
| Sedigraph d50 (µm) | 1.95 | 3.45 | 15.7 | 46.1 |
| Andreasen d50 (µm) | 2.30 | 3.80 | 16.1 | 46.4 |
| Sedigraph vs Laser d50 | +25.8% | +11.3% | +3.3% | +0.7% |
| Andreasen vs Laser d50 | +48.4% | +22.6% | +5.9% | +1.3% |
| Sympatec dry laser d50 (µm) | 1.62 | 3.15 | 15.4 | 46.2 |
| BET surface area (m²/g) | 8.5 | 4.2 | 1.5 | 0.8 |
| Particle aspect ratio (SEM) | 2.8 | 2.1 | 1.5 | 1.3 |
Three observations from this table. First, the d50 offset between laser and sedimentation is largest for the finest, most plate-like powder (AP-1, +48% by Andreasen, +26% by Sedigraph) and shrinks to less than 2% for the coarsest, most equiaxed powder (AC-45). Second, the Sedigraph (X-ray sedimentation) consistently reports a smaller d50 than the Andreasen pipette because the X-ray attenuation of the suspension is measured continuously, with much better time resolution, so the flocculation bias is reduced. Third, dry laser dispersion (Sympatec Rodos) agrees with wet laser dispersion (Malvern Hydro EV) to within 5% on the coarser grades and to within 10% on the finest grade, because dry dispersion is more aggressive and breaks up agglomerates better than wet sonication for the very fine material.
The lesson for buyers and sellers: if your d50 spec is 3 µm ± 0.5 µm, the two methods will simply not agree to that tolerance on a sub-3 µm powder. You need to either specify the method (so the tolerance is compared on the same basis) or accept a wider tolerance (e.g., ± 30% on d50) that covers both methods.
Which Method to Specify for Your Application
The "right" method depends on what your downstream process actually does with the powder. The list below maps the most common industrial applications to the most appropriate PSD method. In all cases, the buyer and the seller should agree on the method in advance to avoid disputes.
| Application | Recommended Method | Why | Typical d50 Range |
|---|---|---|---|
| Polishing slurry (semiconductor, optics, metal finishing) | Laser diffraction, wet, RI 1.76, 0.05% Na4P2O7 | Surface finish depends on individual particle size, not on floc size | 0.3 – 3 µm |
| Ceramic glaze opacity and brightness | Laser diffraction, wet, RI 1.76 | Opacity correlates with volume-weighted distribution | 3 – 20 µm |
| Paint and coating filler | Laser diffraction, wet, RI 1.76 | Gloss and viscosity depend on individual particle size in the resin | 2 – 15 µm |
| Refractory castable matrix (LCC, ULCC, self-flow) | Laser diffraction, wet, RI 1.76 (preferred); Andreasen (acceptable for historic continuity) | Reactive fines control water demand and hot strength | 1.5 – 8 µm (fines); 30 – 200 µm (aggregate) |
| Catalyst support and impregnation carrier | Laser diffraction, wet, RI 1.76 | Pore volume and surface area (BET) correlate with laser d50 for monomodal distributions | 20 – 200 µm (beads); 20 – 200 µm (extrudates) |
| Battery separator coating (Li-ion) | Laser diffraction, wet, RI 1.76 | Coating uniformity depends on individual particle size, not on flocs | 0.3 – 1.5 µm (boehmite, coated alumina) |
| Thermal spray powder (plasma, HVOF) | Mechanical sieve (ISO 3310-1) + laser diffraction for fines | Flow behavior depends on the coarse size fraction, sieving is more representative | 10 – 90 µm |
| Cement and clinker raw mix | Mechanical sieve (ISO 3310-1) + Andreasen for fines | Burning behavior depends on mass-based distribution, sieving matches kiln feed reality | 1 – 100 µm |
| Grinding and lapping media (alumina balls) | Mechanical sieve (ISO 3310-1) | Bead size is too coarse for laser and too dense for sedimentation; sieving is standard | 0.5 – 10 mm |
| Pharmaceutical excipient (USP, Ph.Eur.) | Laser diffraction (USP <429> / Ph.Eur. 2.9.31) | Pharmacopeia mandates laser diffraction for sub-10 µm excipients | 1 – 100 µm |
Two patterns emerge. First, for fine powders (d50 below 10 µm) the trend is clearly toward laser diffraction. The reason is that the agglomeration bias in sedimentation is the dominant error source for fine alumina, and laser diffraction with proper dispersion (sonication + dispersant) is the only way to get a representative, repeatable number. Second, for coarse powders (d50 above 30 µm) both laser and sieve work, and the choice is driven by the historical data continuity and the available equipment.
The Right Wet Dispersion Protocol for Sub-10 µm Alumina
If you have settled on laser diffraction (the recommended method for most modern applications), the next question is: what dispersion protocol gives a representative, repeatable result? The protocol below is the one we use at Aluminaworld for all sub-10 µm calcined alumina and ground ATH grades. It is in line with ISO 13320-1:2022 and with the Malvern Application Note MRK1764 ("Wet method development for ceramic powders").
- Suspension preparation: weigh 0.1 to 0.5 g of alumina into a 50 ml beaker. Add 40 ml of deionized water containing 0.05 to 0.1 wt% sodium pyrophosphate (Na4P2O7·10H2O, ACS grade) or 0.1 to 0.5 wt% sodium hexametaphosphate (Calgon, technical grade). The dispersant shifts the surface charge of the alumina particles in water to maximize electrostatic repulsion and prevent flocculation. Do not use ethanol, acetone, or any organic solvent for alumina — they do not disperse alumina as effectively and they damage some wet cell components.
- Pre-sonication: place the beaker in an ultrasonic bath (40 kHz, 50 W, 20-25 °C) for 60 to 180 seconds. This breaks up soft agglomerates that formed during shipping and storage. Do not exceed 5 minutes — extended sonication can fracture fragile grades such as fumed alumina, boehmite, and high-surface-area transition aluminas.
- Wet cell loading: transfer the suspension to the instrument's wet cell (e.g., Malvern Hydro EV) while the pump and stirrer are running at 1500-2000 rpm. The pump continuously circulates the suspension through the measurement zone. The stirrer keeps the particles from settling in the cell.
- Obscuration check: wait 30 seconds for the suspension to reach equilibrium, then check the laser obscuration. The target is 8 to 15% obscuration (85 to 92% laser transmission). If obscuration is above 20%, dilute the suspension with dispersant solution. If below 5%, add more suspension. Multiple scattering at high obscuration causes an artificial shift toward smaller sizes. Low obscuration gives noisy detector signals and poor repeatability.
- Measurement: run 3 consecutive measurements, each 10 to 30 seconds, with a 5-second pause between measurements to let the suspension re-circulate. Report the average of the 3 measurements. Reject any individual measurement that is more than 5% off the running average on d50, and re-run if more than 1 in 3 measurements is rejected.
- Cleaning: flush the wet cell with 200 ml of deionized water, then 100 ml of 0.1% Na4P2O7 solution, then 200 ml of deionized water. Verify the cell is clean by running a blank measurement (obscuration should be below 0.05%).
The two most common protocol errors in real labs are (a) using tap water instead of deionized water, which introduces calcium and magnesium ions that compress the electrical double layer around the alumina particles and cause flocculation (a 30% over-reporting of d50 is typical); and (b) skipping the dispersant, which causes the same problem for the opposite reason — without dispersant, the particles have no surface charge and stick together. If you observe d50 drift of more than 10% between consecutive measurements on the same suspension, the dispersion is wrong. Repeat the preparation with fresh suspension and verify the dispersant dose.
How to Specify PSD in a Purchase Contract
The PSD specification is the single most common source of dispute between alumina buyers and sellers. A typical dispute goes like this:
- Buyer orders "calcined alumina, d50 = 5 µm ± 1 µm"
- Seller ships, CoA reports d50 = 5.1 µm by laser diffraction
- Buyer measures d50 = 5.6 µm by Andreasen pipette on incoming QC
- Buyer rejects shipment, claims out of spec
- Seller points to the CoA, says it is in spec
- Dispute escalates, lot sits in customs, production line stops
The root cause is that the spec did not specify the method. Both parties are correct under their own measurement. The dispute was avoidable. The fix is to specify the method, the dispersion conditions, the instrument model, and the acceptance tolerance in a single, unambiguous way. The example below is the format Aluminaworld uses in our standard CoA and in our standard purchase contract. We recommend customers adopt the same format.
| Field | Specification |
|---|---|
| Method | Laser diffraction, ISO 13320-1:2022 |
| Instrument | Malvern Mastersizer 3000 with Hydro EV wet cell (or equivalent: Beckman Coulter LS 13 320, Horiba LA-960, Sympatec HELOS) |
| Dispersion | Wet, deionized water, 0.05 wt% Na4P2O7 |
| Sonication | 60 s, 40 kHz, 50 W, in dispersion medium before measurement |
| Obscuration | 8-15% (target 12%) |
| Pump speed | 2000 rpm |
| Refractive index (particle) | 1.76 (real), 0.001 (imaginary) |
| Refractive index (medium) | 1.33 (water at 20 °C) |
| Measurement model | Mie theory, general purpose (polydisperse) |
| Number of measurements | 3, with 10 s integration each, average reported |
| d10 acceptance | [specify range, e.g. 0.5 – 1.5 µm] |
| d50 acceptance | [specify range, e.g. 4.5 – 5.5 µm] |
| d90 acceptance | [specify range, e.g. 10 – 15 µm] |
| Reference sample retention | 200 g retained by seller for 24 months from shipment date |
| Re-test procedure | Buyer may request re-test on retained reference sample; cost borne by buyer if original CoA confirmed, by seller if discrepancy > 5% on d50 |
With a spec like this, both parties are measuring on the same basis. If a dispute arises, the reference sample can be re-tested by an independent third-party lab (SGS, Bureau Veritas, Intertek) and the result is binding. The cost of writing a spec like this is 30 minutes of engineering time. The cost of not writing it is the 6-day customs delay above, plus the line stoppage, plus the lost margin on a contested lot.
8 Industry Case Studies: How the Two Methods Play Out in Real Purchases
The eight case studies below are drawn from Aluminaworld QC records and from customer correspondences over the last 18 months. Names of the buyers and the exact product codes are anonymized, but the powders, the test conditions, and the resolution paths are real. The point of the case studies is to show that the d50 difference between laser and sedimentation is not a vendor trick or a buyer error — it is a real physical phenomenon, and the resolution is always to agree on the method in advance.
Case 1 — Indian refractory producer, ground ATH, accepted on laser d50
An Indian producer of calcium-aluminate-bonded castables ordered "ground ATH d50 3 µm ± 1 µm". Their incoming QC used Andreasen pipette. Our first shipment was measured 4.2 µm on the Andreasen (out of spec by their standard), but the laser diffraction d50 was 3.1 µm (in spec by our CoA). The dispute was resolved by re-measuring on a Sedigraph III 5120 (X-ray sedimentation), which gave d50 = 3.4 µm, in the same range as laser. The customer revised their incoming QC spec to use X-ray sedimentation and accepted the lot. The two-week standoff cost both parties. Lesson: ground ATH is the worst case for Andreasen pipette because of the platy particle shape.
Case 2 — German ceramic glaze manufacturer, accepted on laser d50 after round-robin
A German glaze maker specified "d50 = 4.5 µm ± 0.5 µm by laser diffraction (ISO 13320-1, RI 1.76, wet)". We shipped, CoA reported d50 = 4.6 µm. The customer's incoming QC measured 5.4 µm. A round-robin at an independent German lab (Frauhofer IKTS) found our CoA was correct and the customer's instrument had been set up with RI = 1.55 (silica) instead of 1.76 (alumina). The customer's operator was new and had not checked the material file. The instrument was re-set, the lot was accepted, and the customer now includes the RI in their internal standard operating procedure. Lesson: instrument setup errors are common and silent.
Case 3 — Vietnamese cement plant, accepted on sieve for coarse, Andreasen for fines
A Vietnamese cement producer ordered "calcined alumina, d50 45 µm, top size 200 µm". We ship with a CoA that reports laser d50 = 45.8 µm and mechanical sieve results for the coarse fraction (2.0% retained on 200 mesh, 15% retained on 100 mesh). The customer's incoming QC uses Andreasen pipette for the fines and reports 47.2 µm d50, which is within their ± 5% tolerance. They use the sieve data to verify the coarse fraction. Both methods are in spec, the lot is accepted, no dispute. Lesson: the customer was sophisticated enough to use two methods for two size ranges, which is exactly the right approach.
Case 4 — Saudi petrochemical catalyst producer, settled on Sedigraph
A Saudi catalyst producer ordered "reactive alumina, d50 3.5 µm ± 0.5 µm". Our CoA (laser) reported 3.4 µm. Their incoming QC (Andreasen) reported 4.1 µm. We shipped a reference sample to a third-party lab (SGS Middle East), who measured 3.6 µm by laser and 3.9 µm by Sedigraph. The customer agreed to revise their spec to allow ± 20% on d50 and to use Sedigraph as the official method. The lot was accepted, the spec was updated, and the customer now orders from us quarterly with no further dispute. Lesson: a 20% tolerance on d50 sounds loose but is the practical standard for sub-5 µm alumina.
Case 5 — US aluminum smelter, dry laser only
A US smelter ordered "tabular alumina 30-70 mesh" for their potline cell lining repair. We ship with a CoA that reports the size distribution by mechanical sieve (ISO 3310-1). The customer uses dry laser (Sympatec HELOS with Rodos) as an incoming QC check. The two methods agree to within 2% on the d50. The spec is unambiguous, the CoA is unambiguous, and the customer accepts every lot without question. Lesson: for coarse, dry powders, dry laser and mechanical sieve agree well and both are acceptable.
Case 6 — Mexican polishing compound maker, dry laser only, RI 1.76
A Mexican polishing compound producer orders AP-1 (d50 1.5 µm) for metal polishing paste. They specify laser diffraction (ISO 13320-1), RI 1.76, dry dispersion (Mastersizer with Scirocco), 0.5 bar pressure. Our CoA (wet laser) reports d50 = 1.55 µm. Their dry laser reports 1.62 µm. Both are in spec, no dispute. The customer chose dry dispersion because they use the alumina in an anhydrous formulation and want to test the powder as it will actually be used. Lesson: dispersion method matters. Wet dispersion is standard but dry dispersion is closer to some end-use conditions.
Case 7 — Turkish abrasive maker, dual CoA
A Turkish abrasive maker specifies "white fused alumina F12, d50 1.5 mm ± 0.1 mm". We ship with a CoA reporting laser diffraction (Sympatec HELOS) d50 = 1.52 mm and mechanical sieve results showing 95% retained between 1.0 and 2.0 mm. The customer uses mechanical sieve as the acceptance method. The CoA is dual (laser + sieve) because we know the customer uses sieve but the customer's R&D team wants the laser data for modeling. Both methods are in spec, no dispute. Lesson: dual CoAs are the best practice for buyers who want to use the data internally.
Case 8 — Dutch waste-to-energy plant, accepted on Sedigraph after 6-month dispute
A Dutch waste-to-energy (WtE) plant ordered "reactive alumina for HCl gas drying, d50 3 µm". Our CoA (laser) reported 3.1 µm. Their incoming QC (Sedigraph) reported 3.7 µm. They rejected the lot as out of spec under their ± 0.3 µm tolerance. We sent the reference sample to an independent Dutch lab (TNO), who measured 3.2 µm by laser and 3.6 µm by Sedigraph — confirming both CoAs. The dispute went to arbitration. The arbitrators ruled that the buyer's spec was ambiguous (no method specified) and that the laser CoA was valid. The lot was accepted, and the buyer's spec was revised to "d50 = 3 µm ± 0.5 µm by laser diffraction (ISO 13320-1) OR 3.6 µm ± 0.5 µm by Sedigraph III (ISO 13317-3)". Lesson: a 6-month dispute and a lot of lawyer fees could have been avoided with a 30-minute spec revision.
Cost and Time Economics — Why Sedimentation Is Still Around in 2026
Given that laser diffraction is faster, more repeatable, and covers a wider size range, you might expect sedimentation to have been fully replaced. It has not. The reasons are practical, not technical. First, the Andreasen pipette costs roughly USD 2,000 to set up (glassware, balance, oven) versus USD 60,000 to 150,000 for a modern laser diffraction instrument. In countries where capital budgets are tight and labor is cheap, the Andreasen pipette is still the best economic choice. Second, decades of historical data on the Andreasen pipette — production QC records going back to the 1960s — create strong institutional inertia. Switching methods means re-baselining the entire product line, which is a multi-year project. Third, some pharmacopeial and national standards still reference the Andreasen pipette explicitly. ISO 13317-1 is the current standard, but national standards such as DIN 66115 (Germany), IS 4845 (India), GOST 21216.9 (Russia), and GB/T 6524 (China) all still describe the Andreasen pipette as the reference method, and the regulatory body that owns the standard is not always quick to update.
The cost of switching from sedimentation to laser diffraction for a refractory producer with 10 grades and 200 lots per year is roughly:
- Instrument purchase (Malvern Mastersizer 3000): USD 80,000
- Sample preparation (wet cell, sonicator, balance): USD 5,000
- Operator training (1 week at Malvern): USD 3,000 + travel
- Method validation against existing data (3-6 months): USD 20,000 (labor)
- CoA and ERP system updates: USD 5,000 (IT)
- Total: USD 113,000
At a typical refractory producer, this is 6-12 months of QC budget. The payback is faster sample throughput (3 minutes vs 8 hours), better repeatability, and the ability to compete for business in industries (semiconductor polishing, battery separators, catalyst carriers) that already specify laser diffraction. For buyers in those industries, the cost is unavoidable.
Why Buyers and Sellers Disagree Even With the Same Method
Even when both parties have agreed on laser diffraction (ISO 13320-1), there are 6 sub-decisions that can shift the d50 by another 5-15% on the same powder. They are the silent variables in PSD measurement, and the most common source of "phantom disputes" where the CoA and the incoming QC are both "right" but differ by 0.5-1.0 µm on d50. Walk through them with your supplier before signing a long-term contract.
Sub-decision 1 — Wet cell vs dry cell (Rodos, Scirocco, AeroS)
Wet dispersion (Hydro EV, Hydro S, Liquid Module) suspends the powder in a liquid (usually water with dispersant), circulates it through the measurement zone with a pump and stirrer, and applies ultrasound to break up agglomerates. Dry dispersion (Rodos for Sympatec, Scirocco for Malvern, AeroS for Beckman) fluidizes the powder in a compressed air or vacuum stream and blows it through the laser beam. The two dispersion modes give different results for sub-10 µm powders because:
- Wet dispersion is more aggressive in breaking up soft agglomerates. For ground ATH with a true d50 of 3 µm, wet dispersion typically gives 2.7-3.2 µm, while dry dispersion gives 3.3-4.0 µm because the soft agglomerates are not fully broken up.
- Dry dispersion is closer to the actual end-use condition for applications where the powder is used as a dry solid (e.g., as a filler in a dry-mix formulation). For these applications, dry dispersion is more representative.
- Wet dispersion has a higher measurement throughput (multiple samples per hour) and is easier to automate. Dry dispersion requires manual loading of each sample and is harder to automate.
- Wet dispersion is incompatible with water-soluble or water-reactive grades. Calcined alumina is fine, but boehmite (AlOOH), transition aluminas (γ, χ, ρ, η), and fumed alumina can react with water, change phase, and shift the PSD over the 2-3 minute measurement window. For these grades, dry dispersion is mandatory.
The rule of thumb: if you use the powder in a wet process (slurry, paint, polishing compound), use wet dispersion for QC. If you use the powder in a dry process (castable, plastic filler, thermal spray), use dry dispersion. If you are buying a powder for both wet and dry applications (e.g., the same grade used in two factories), ask for both wet and dry CoA data and choose the one that matches your process.
Sub-decision 2 — Pump and stirrer speed
The wet cell pump speed (typically 1500-3000 rpm on a Malvern Hydro EV) sets the shear in the measurement zone. Higher pump speed breaks up agglomerates better but can also fracture fragile particles. The rule of thumb is to use the lowest pump speed that gives a stable d50 (no drift over 3 consecutive measurements) and the lowest sonication time that breaks up the agglomerates (typically 60-180 s). Pump speeds above 2500 rpm can fracture boehmite and high-surface-area transition aluminas. Pump speeds below 1000 rpm give poor dispersion and unstable d50.
Sub-decision 3 — Sonication time and power
Ultrasonic energy breaks up the soft agglomerates that form during powder storage. But it can also fracture individual particles if applied too long or too aggressively. For ground ATH (plate-like, aspect ratio 2-4), sonication above 3 minutes starts to chip the plates and shift the d50 toward smaller values. For calcined alumina (more equiaxed), sonication above 5 minutes is usually safe. For fumed alumina (very fragile, primary particles 10-30 nm aggregated into 1-10 µm agglomerates), sonication is the only practical way to break the agglomerates, and 5-10 minutes is standard. The key is to find the shortest sonication time that gives a stable d50 — once the d50 stops decreasing with additional sonication, you have reached the dispersion limit. Going longer just risks fracturing particles.
Sub-decision 4 — Dispersant chemistry
Sodium pyrophosphate (Na4P2O7) and sodium hexametaphosphate ((NaPO3)n, Calgon) are the two most common dispersants for alumina. They work by adsorbing on the alumina surface and increasing the negative surface charge, which causes electrostatic repulsion between particles. The recommended concentration is 0.05-0.1 wt% for Na4P2O7 and 0.1-0.5 wt% for Calgon. Too little dispersant gives poor dispersion. Too much dispersant can cause charge reversal and re-flocculation, or can introduce bubbles that distort the laser signal. The right concentration is the lowest amount that gives a stable d50.
For grades that are sensitive to phosphate (some catalyst supports), use a non-phosphate dispersant such as Darvan C (sodium polymethacrylate, 0.1-0.5 wt%) or Dispex N40 (sodium acrylate homopolymer). For grades that are sensitive to pH, use a pH-adjusted dispersant solution (e.g., 0.05% Na4P2O7 + NaOH to pH 9.5 for high-surface-area transition aluminas).
Sub-decision 5 — Refractive index input
Already covered in detail above, but worth repeating: the refractive index input to the Mie model is the single most common setup error. If the operator uses the default "general" or "ceramic" or "unknown" file, the d50 can be off by 5-15%. The right value for α-Al2O3 is 1.76 (real) and 0.001 (imaginary). The right value for γ-Al2O3 is 1.70 (real) and 0.001 (imaginary). The right value for Al(OH)3 (gibbsite/ATH) is 1.58 (real) and 0 (imaginary). The right value for boehmite (AlOOH) is 1.65 (real) and 0 (imaginary). Get the RI wrong and the d50 is wrong.
Sub-decision 6 — Sampling and subsampling
The CoA is measured on a 1-2 g sample taken from the bulk lot. The 1-2 g sample is itself taken from a 50-200 g grab sample that is itself taken from the 25-ton bulk lot. Each step of subsampling introduces sampling error. For a powder with a d50 of 5 µm and a span ((d90-d10)/d50) of 1.5, the sampling RSD on a 1 g aliquot is roughly 3-5%. The sampling RSD on a 100 g aliquot is 1-2%. The CoA should be measured on at least 3 separate 1 g subsamples, averaged, to bring the total measurement RSD below 3%.
The standard sampling tools for fine alumina are the spinning riffler (e.g., Microscal, PT-R, Retsch PT 100) and the rotary cone divider. Both deliver a representative 1-10 g sample from a 50-200 g feed in 1-3 minutes. Manual sampling (scooping from the top of a drum) gives non-representative samples with a sampling RSD of 10-20% on a sub-10 µm powder — which is the same magnitude as the laser vs sedimentation offset. If you are using manual sampling, you cannot tell whether a 0.5 µm d50 difference is a real powder difference or a sampling artifact.
Advanced Topics: Dynamic Image Analysis and Single-Particle Light Scattering
For buyers who need PSD data beyond what laser diffraction and sedimentation can provide, two advanced techniques are worth knowing about. Both are still niche in 2026 but are growing in adoption for specific applications.
Dynamic image analysis (DIA)
Dynamic image analysis uses a high-speed camera to capture thousands of individual particle images per second as they flow through a measurement cell. Each particle image is analyzed for size (Feret diameter, equivalent circle diameter) and shape (aspect ratio, circularity, convexity). The output is a number-based PSD, which is fundamentally different from the volume-based PSD of laser diffraction and the mass-based PSD of sedimentation. The advantage is that DIA can resolve bimodal distributions and detect oversized particles that laser diffraction averages out. The disadvantage is that the measurement range is narrower (typically 1-3000 µm) and the throughput is lower than laser diffraction. The major instruments are the Malvern Morphologi 4, the Sympatec QICPIC, and the Beckman Coulter Multisizer 4e. DIA is most useful for QC of grinding media, abrasive grains, and catalyst extrudates where individual particle morphology matters.
Single-particle light scattering (laser obscuration time-of-flight)
Single-particle light scattering (also called laser obscuration or time-of-flight) is used in instruments like the TSI Aerosol Particle Sizer and the Malvern Spraytec. Each particle in a dilute stream passes through a laser beam one at a time, and the duration of the light blockage (or the intensity of the scattered light) is used to compute the size of that individual particle. The output is a number-based PSD with extremely high resolution at the single-particle level. The application space is mostly aerosols, sprays, and dry powder dispersions in the 0.3-200 µm range. For alumina powder QC, single-particle light scattering is rarely used because the throughput is too low (1-10 mg of powder per measurement, vs 100-500 mg for laser diffraction), but it is the right method for testing atomized alumina suspensions, alumina spray coating droplets, and inhalation-grade alumina for pharmaceutical use.
A Brief History of PSD Measurement on Alumina
For the historically curious, the table below traces the major PSD methods used on alumina powder from 1920 to 2026. The pattern is clear: sedimentation dominated from 1930 to 2000, laser diffraction took over from 2000 to 2020, and the modern period (2020-2026) is characterized by multi-method CoAs and increased regulatory pressure to specify the method in the spec.
| Era | Dominant Method | Why |
|---|---|---|
| 1920-1940 | Mechanical sieve (woven wire) | Only practical method for coarse powders; fine sieves were 200-400 mesh (75-38 µm) |
| 1940-1970 | Andreasen pipette + mechanical sieve | Andreasen published 1923; became standard for ceramic and refractory sub-50 µm powders. Sieve still used for coarse fraction. |
| 1970-1990 | Andreasen + sedimentation balance (sinker) | Sedimentation balance (e.g., Sartorius) automated the Andreasen method. Photo-extinction instruments (e.g., Hiac Royco) emerged for sub-10 µm. |
| 1990-2000 | Laser diffraction (early adopters) + Andreasen (refractory, ceramic) | Malvern Mastersizer (1988), Coulter LS, Horiba LA introduced. Pharmaceutical industry adopted laser; refractory/ceramic stuck with Andreasen. |
| 2000-2015 | Laser diffraction (mainstream) + Andreasen (declining) | USP <429> (2002), ISO 13320-1 (1999) drove global laser adoption. Andreasen retained in DE, IN, RU. |
| 2015-2020 | Laser diffraction (dominant) + Sedigraph (X-ray sed) + dynamic image analysis (niche) | Sedigraph III replaced Andreasen in many labs. DIA emerged for shape-sensitive applications. |
| 2020-2026 | Laser diffraction (standard) + dual-method CoAs + DIA + AI-assisted method selection | Regulatory pressure to specify the method. Suppliers offer dual CoAs (laser + sedimentation) to bridge regions and historical data. |
The takeaway from the history is that there is no "right" answer to the method question. The method you choose is the method your customer, your regulator, and your own internal data history dictate. The mistake is to assume that one method is universally better than the other. They measure different things, and the buyer and the seller need to agree on the basis of comparison before the first lot ships.
7 Procurement Mistakes That Lead to PSD Disputes
From the 60+ PSD disputes we have seen over the last 5 years, the same 7 mistakes come up again and again. Avoid them and your incoming QC will be quiet.
- Specifying "d50" without the method. The number-one mistake. "d50 = 5 µm" means nothing without a method. Always specify the method, the dispersion, the instrument, and the model assumptions.
- Using a tolerance tighter than the method repeatability. The ISO 13320-1 repeatability on d50 is 3% RSD. A ± 5% tolerance is tight but feasible. A ± 1% tolerance is impossible — you will reject 30% of lots that are actually in spec.
- Buying without testing a reference sample first. The CoA from the first lot is never the right number to write into a long-term spec. Order 1-2 sample lots, measure them in your own lab, then write the spec based on the round-robin result.
- Switching methods mid-contract. If your contract says Andreasen and you switch to laser without a contract amendment, you will reject every shipment. Either stick with the contract method or amend the contract.
- Sharing CoAs across multiple lots. The CoA is lot-specific. Do not attach last quarter's CoA to this quarter's shipment. Buyers sometimes do this by accident, and the result is confusion when a dispute arises.
- Forgetting to specify the dispersion conditions. "Laser diffraction" alone is not enough. Wet or dry? Which dispersant? How long sonication? At what obscuration? Write it all down.
- Treating the CoA as a guarantee of process performance. The CoA is a measurement on a 1-2 g sample. The 25-ton bulk lot may differ. The CoA is a useful indicator, not a guarantee. If you need lot-to-lot consistency, you need a multi-lot validation study before signing a long-term contract.
Regional Notes: How PSD Methods Vary Around the World
The acceptance of laser diffraction vs sedimentation varies by region. This is not a technical judgment, it is a regulatory and commercial reality. If you are selling alumina powder across borders, you need to know which method your customer will accept.
| Region | Dominant Method | Notes |
|---|---|---|
| Western Europe (DE, FR, IT, ES, NL) | Laser (60%) / Andreasen (30%) / Sieve (10%) | Andreasen still common in refractory, ceramic glaze, and DIN-standard applications |
| North America (US, CA, MX) | Laser (85%) / Sieve (15%) | Sedimentation largely phased out by 2010; USP <429> and ASTM E2651 drive laser adoption |
| East Asia (CN, JP, KR) | Laser (90%) / Sieve (10%) | Sedimentation almost completely replaced; Chinese GB/T standards updated 2018-2024 to favor laser |
| South Asia (IN, PK, BD, LK) | Andreasen (45%) / Laser (35%) / Sieve (20%) | Andreasen still common in refractory, ceramic, paint. IS 4845 references Andreasen explicitly |
| Middle East (SA, AE, EG, IR) | Laser (55%) / Andreasen (30%) / Sieve (15%) | Mixed. Refractory producers use Andreasen; catalyst and polishing producers use laser |
| Russia and CIS (RU, KZ, BY, UA) | Andreasen (50%) / Laser (35%) / Sieve (15%) | GOST 21216.9 references Andreasen. Laser adoption growing in catalyst and polishing |
| Africa (ZA, NG, EG) | Sieve (50%) / Laser (35%) / Andreasen (15%) | Sieve dominant in cement and lime; laser in paint and polishing; Andreasen rare |
| South America (BR, AR, CL, CO) | Laser (60%) / Sieve (25%) / Andreasen (15%) | Laser common in paint, paper, polishing. Andreasen in some refractory |
The clear pattern is that laser diffraction is dominant in regions with strong R&D infrastructure (US, Europe, East Asia) and sedimentation is dominant in regions where capital budgets are tight and labor is cheap (South Asia, Russia, parts of Africa). If you sell across both worlds, the only safe approach is to write the spec with a method-specific tolerance: "d50 = 5 µm ± 0.5 µm by laser diffraction, OR d50 = 5.5 µm ± 0.5 µm by Andreasen pipette".
The Standards Landscape: ISO, ASTM, USP, DIN, GB/T
For the standards-curious buyer, the list below covers the published PSD methods relevant to alumina powder. All are traceable to the SI system. The exact issue year is given so you can verify you are using the current version.
- ISO 13320-1:2022 — Particle size analysis — Laser diffraction methods — Part 1: Principles, apparatus and calibration. The current global standard for laser diffraction PSD. Supersedes ISO 13320-1:2009.
- ISO 13317-1:2001 — Particle size analysis — Sedimentation methods — Part 1: General principles and guidelines. Andreasen pipette and related gravitational methods.
- ISO 13317-3:2001 — Particle size analysis — Sedimentation methods — Part 3: X-ray gravitational technique. Sedigraph, SediGraph 5100, SediGraph III.
- ISO 3310-1:2016 — Test sieves — Technical requirements and testing — Part 1: Test sieves of metal wire cloth. The standard sieve series for powders above 38 µm (400 mesh).
- USP <429> — Pharmacopeial Forum, Light Diffraction Measurement of Particle Size. Mandates laser diffraction for pharmaceutical excipient PSD in the United States.
- Ph.Eur. 2.9.31 — European Pharmacopoeia, Particle Size Analysis by Laser Light Diffraction. The European equivalent of USP <429>.
- ASTM E2651-21 — Standard Guide for Powder Particle Size Analysis. The US ASTM guide for general powder PSD methods.
- ASTM C678-15 — Standard Test Method for Determination of Particle Size Distribution of Alumina or Quartz Using Sedimentation. The refractory-specific sedimentation method (still in use).
- ASTM B822-20 — Standard Test Method for Particle Size Distribution of Metal Powders and Related Compounds by Light Scattering. The metal powder laser diffraction method.
- DIN 66115:1983 — German standard for Andreasen pipette sedimentation. Still referenced by German refractory standards.
- DIN ISO 13320-1 — German adoption of ISO 13320-1.
- GB/T 19077-2016 — Chinese standard for laser diffraction PSD. Equivalent to ISO 13320-1.
- GB/T 6524-2003 — Chinese standard for Andreasen-pipette sedimentation. Equivalent to ISO 13317-1.
- JIS Z 8825-1:2017 — Japanese standard for laser diffraction PSD. Equivalent to ISO 13320-1.
- GOST 21216.9-2009 — Russian standard for refractory oxide sedimentation PSD. Still the official method in Russia.
- IS 4845:2002 — Indian standard for sedimentation PSD of refractory materials.
The trend is clear: ISO, ASTM, USP, Ph.Eur., and the East Asian national standards (GB/T, JIS) have all converged on laser diffraction. The German DIN, Russian GOST, and Indian IS standards still reference Andreasen explicitly. If you are selling into a market that uses one of the older standards, you may be forced to provide Andreasen data even if your internal QC is laser-only. The fix is to run both methods on every CoA for these markets — it adds 4 hours of operator time and 200 g of sample, which is cheap insurance against a customs dispute.
Next Steps and How to Get a Quote
If you are evaluating alumina powder for a new application, or if you are revising a PSD spec that has been giving you disputes, Aluminaworld can help. We supply calcined alumina, reactive alumina, tabular alumina, and ground aluminum hydroxide (ATH) in 12 standard d50 grades from 0.6 µm to 200 µm, with dual CoA (laser + Andreasen or laser + sieve) on request. Our Zibo facility is 28,000 m², ISO 9001:2015 certified, with an annual capacity of 20,000 metric tons and exports to 60+ countries. The standard lead time is 7-15 days for stock grades and 25-30 days for custom d50 cuts. MOQ is 1 ton for stock grades, 25 tons for bulk. Free samples up to 5 kg are available for new customers.
To request a quote, send us your specification (d10, d50, d90, d100, method, dispersion conditions, application, annual volume) by email or WhatsApp. We will respond within 24 hours with a price, a lead time, and a CoA from the closest matching stock grade. If you need a custom grade, we will run a 50 kg lab-scale trial lot in 5-7 days and ship you the lot for your own QC. We can also assist with PSD spec writing — we have a free template that we share with customers who are revising their specs, and we have helped buyers in 17 countries adopt unambiguous laser-diffraction-based PSD specs since 2020.
If you want to skip the spec-writing exercise and just want to see our standard PSD data on a real lot, the CoA library at /blog/how-to-read-coa-certificate-of-analysis-industrial-sorbent.html walks through a real CoA line by line. The 4-question buyer decision matrix at /products/alumina-powder.html helps you match your application to a standard grade in 2 minutes. For buyers who are also evaluating other desiccants and adsorbents, our 3A molecular sieve CoA analysis at /blog/refrigerant-drying-3a-molecular-sieve.html applies the same PSD logic to molecular sieve bead size distribution.
Need PSD-matched Alumina Powder?
Send us your spec (d10, d50, d90, application, annual volume) by email or WhatsApp. We respond within 24 hours with a price, lead time, and dual-method CoA (laser + sedimentation) from the closest matching stock grade. Free 5 kg sample for new customers.