How to Calculate Adsorbent Bed Pressure Drop: Ergun Equation, Real-World Examples, and Particle Size Trade-Offs for Molecular Sieve and Activated Alumina
If you design, specify, or troubleshoot a fixed-bed adsorber - PSA oxygen, compressed air dryer, natural gas dehydration, hydrogen purification - the bed pressure drop directly sets compressor power, sieve attrition, and operating cost. This guide walks through the Ergun equation step by step, runs four worked examples on real industrial conditions, and gives the practical particle size trade-offs that decide whether your bed runs clean for five years or chokes on fines after eighteen months.
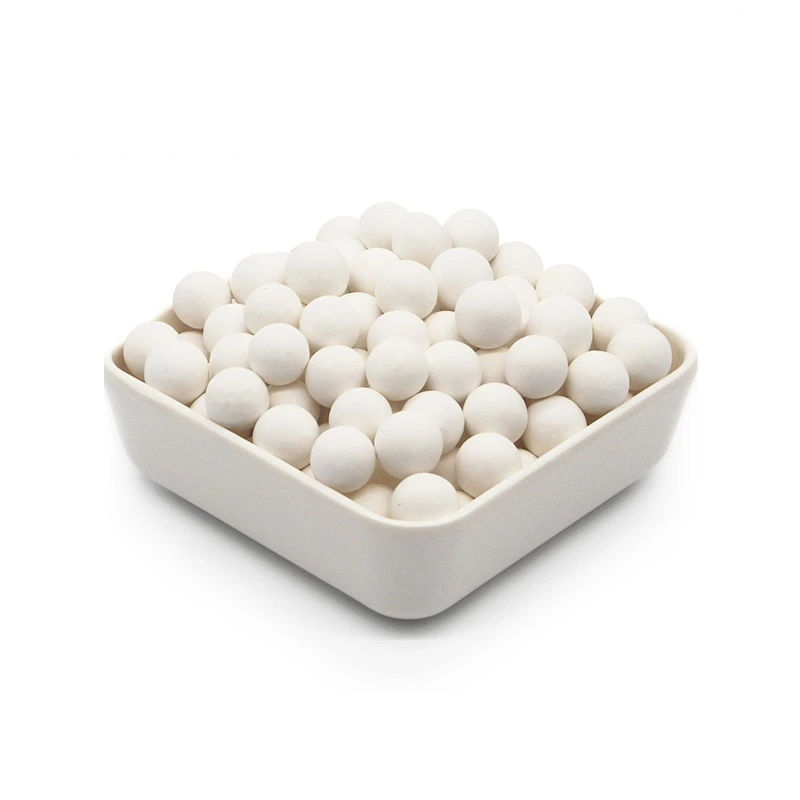
Why Adsorbent Bed Pressure Drop Matters
Every fixed-bed adsorber has a pressure drop. Feed gas enters the top of the tower at high pressure, percolates down through the packed bed of beads, and exits at the bottom at slightly lower pressure. That pressure difference (delta P) is not free - it costs compressor work, generates heat that the sieve must dissipate, and at extreme levels it can fluidize the bed or crush particles into fines.
In a typical industrial adsorber the design targets for total bed pressure drop are:
- Compressed air dryer (heatless desiccant): 0.3 to 0.5 bar (5 to 7 percent of 7 bar feed)
- Natural gas dehydration (TSA): 0.2 to 0.5 bar (1 to 3 percent of 40 to 70 bar feed)
- PSA oxygen concentrator: 0.05 to 0.12 bar (3 to 8 percent of 1.4 bar adsorption)
- Hydrogen PSA: 0.10 to 0.30 bar (1 to 3 percent of 20 bar feed)
If pressure drop exceeds 8 percent of feed pressure, two things start to go wrong: (1) the compressor or feed blower must work harder, raising operating cost by 5 to 15 percent over the unit lifetime; (2) the bed begins to vibrate and shift under the higher differential pressure, accelerating sieve attrition and dust generation. In extreme cases fines accumulate in the lower part of the bed, drop rises another 20 to 30 percent within months, and the tower has to be opened for sieve replacement.
Designing the bed pressure drop correctly up front avoids all of this. The tool for that is the Ergun equation, published in 1952 and still the workhorse correlation for any packed bed of solid particles - adsorbent beads, catalyst pellets, sand, even grain in a silo.
The Ergun Equation: A 70-Year-Old Workhorse
In 1952, Sabri Ergun at the Carnegie Institute of Technology published a correlation that combined two physical effects - viscous energy loss (the laminar term) and kinetic energy loss (the inertial term) - into a single equation for pressure drop across a packed bed:
dP    150 * (1 - eps)^2    mu * v        1.75 * (1 - eps)    rho * v^2
--- = ----------------- * --------  +   ----------------- * ---------
 L       eps^3            dp^2              eps^3              dp
Where:
dP/L= pressure drop per unit bed length (Pa/m)eps= bed void fraction (dimensionless, 0.35 to 0.45 typical)mu= gas dynamic viscosity (Pa.s)v= superficial gas velocity (m/s)dp= particle diameter (m)rho= gas density (kg/m3)
The first term dominates at low Reynolds number (Re_p below 10), where flow is essentially laminar. The second term dominates at higher Re_p (above 100), where inertial effects take over. Most industrial adsorbers run at Re_p between 1 and 1000, which is exactly the regime where Ergun is most accurate - within plus or minus 20 percent against experimental data, validated against more than 2,000 measurements across particle sizes from 0.05 mm to 50 mm.
Where Ergun came from
Ergun fit his equation to two earlier correlations - the Kozeny-Carman equation for viscous flow in porous media and the Burke-Plummer equation for turbulent packed bed flow - and showed that a single weighted sum reproduces both. The 150 constant for the viscous term and the 1.75 constant for the inertial term are empirical but well-validated across decades of catalysis and adsorption engineering. They appear unchanged in every major chemical engineering textbook (McCabe, Smith and Harriott; Perry's Chemical Engineers' Handbook; Coulson and Richardson) and are the basis for the equivalent diameter concept used in packed tower design.
What Ergun does not handle
The Ergun equation assumes uniform spherical particles, uniform void fraction, isothermal flow, no chemical reaction, and no condensation or evaporation in the bed. For adsorbers it is usually accurate enough, but for these special cases modify the calculation:
- Non-spherical particles (extrudates, crushed granules): Multiply particle diameter by sphericity factor phi (0.6 to 0.9 typical). Most engineered adsorbents are near-spherical and phi approaches 1.0.
- Wall effects in small-diameter columns: If vessel diameter D is less than 20 * dp, increase pressure drop by 5 to 15 percent over the Ergun prediction.
- Heat of adsorption effects: Temperature rise of 5 to 20 degrees C is common in the mass transfer zone. Use viscosity and density at average bed temperature, not inlet temperature.
- Multicomponent adsorption: Ergun is purely hydrodynamic. Actual cycle time and breakthrough depend on the adsorption equilibrium and kinetics, not just pressure drop.
Key Input Properties You Need
Before running the calculation, you need to gather six inputs. The two that engineers most often get wrong are void fraction and gas viscosity at high pressure. Below is a quick reference table for the four sieves this guide covers.
| Adsorbent | Typical bead size | Particle density (kg/m3) | Bulk density (kg/L) | Void fraction (eps) | Sphericity (phi) |
|---|---|---|---|---|---|
| Molecular sieve 4A (1.6-2.5 mm) | 2.0 mm | 1150-1250 | 0.70-0.75 | 0.40 | 0.95 |
| Molecular sieve 5A (2.0-3.0 mm) | 2.5 mm | 1150-1250 | 0.70-0.75 | 0.40 | 0.95 |
| Molecular sieve 13X (1.6-2.5 mm) | 2.0 mm | 1100-1200 | 0.65-0.70 | 0.40 | 0.95 |
| Molecular sieve 5A (3-5 mm) | 4.0 mm | 1150-1250 | 0.72-0.78 | 0.38 | 0.95 |
| Activated alumina (2-5 mm beads) | 3.5 mm | 950-1050 | 0.75-0.85 | 0.42 | 0.85 |
| Activated alumina (1-3 mm beads) | 2.0 mm | 950-1050 | 0.78-0.85 | 0.42 | 0.85 |
| Activated alumina (3-5 mm pellets) | 4.0 mm | 950-1050 | 0.75-0.80 | 0.38 | 0.75 |
Two notes on these numbers. First, particle density (also called skeletal or true density) is measured by helium pycnometry on a finely ground sample. Bulk density is measured by simply pouring a known mass into a graduated cylinder. The two are related by void fraction: rho_bulk = rho_particle * (1 - eps). Second, Aluminaworld publishes both numbers on every lot Certificate of Analysis (CoA) and can run a custom particle size distribution (PSD) sieve analysis on request. Always use the actual lot values, not textbook averages.
For gas properties, the most common mistake is using atmospheric-pressure viscosity and density in a high-pressure adsorber. Methane at 70 bar has viscosity around 1.4e-5 Pa.s (vs 1.1e-5 at 1 bar) and density around 56 kg/m3 (vs 0.7 at 1 bar). Both effects change the Ergun result by 5 to 15 percent.
Worked Example 1: 4A Molecular Sieve Natural Gas Dehydration at 40 bar
A natural gas processing plant dehydrates sales gas with a 4A molecular sieve tower. The operating conditions:
- Vessel inside diameter: 1.50 m
- Bed height: 4.00 m
- Particle size: 3 to 5 mm beads (4 mm average)
- Feed gas: methane at 40 bar (g), 35 degrees C, 15,000 Nm3/h
- Void fraction: 0.38
- Particle density: 1200 kg/m3, bulk density: 744 kg/L
Step 1: convert flow to superficial velocity. Cross-sectional area = pi * (1.50/2)^2 = 1.767 m2. Operating density at 40 bar (g) (41 bar absolute) and 35 degrees C: rho = (41 * 1e5 * 16e-3) / (8.314 * 308) = 25.6 kg/m3. Actual volumetric flow = (15000 * 1.013e5 / (41e5 + 1.013e5)) * (308 / 273) = 1245 m3/h = 0.346 m3/s. Superficial velocity v = 0.346 / 1.767 = 0.196 m/s.
Step 2: compute Re_p. Methane viscosity at 40 bar 35 degrees C is approximately 1.30e-5 Pa.s. Re_p = rho * v * dp / mu = 25.6 * 0.196 * 0.004 / 1.30e-5 = 1544. This is well into the inertial-dominated regime, where the second Ergun term dominates.
Step 3: run the Ergun equation. Viscous term: (150 * (0.62)^2 / (0.38)^3) * (1.30e-5 * 0.196 / (0.004)^2) = 1042 Pa/m. Inertial term: (1.75 * 0.62 / (0.38)^3) * (25.6 * 0.196^2 / 0.004) = 6038 Pa/m. Total = 7080 Pa/m = 7.08 kPa/m = 0.0708 bar/m.
Step 4: total bed drop. 0.0708 * 4.0 = 0.283 bar. As a percentage of 40 bar (g) feed: 0.283 / 40 * 100 = 0.71 percent. That is well below the 5 percent rule-of-thumb ceiling, leaving plenty of margin. The design is conservative - the bed could be shortened to 3.0 m and still meet 0.55 percent drop, or the flow could be raised to 25,000 Nm3/h before hitting the 3 percent threshold.
This is the design sweet spot for a high-pressure gas dryer. Most operating natural gas dehydrators run between 0.3 and 2.0 percent bed drop, which means the Ergun prediction is rarely the bottleneck - the binding constraint is usually regeneration energy and breakthrough time.
Worked Example 2: PSA Oxygen Concentrator with LiLSX at 1.4 bar
A 5 LPM home medical oxygen concentrator uses lithium low-silica X (LiLSX) molecular sieve. Operating conditions:
- Bed inside diameter: 40 mm
- Bed height: 250 mm per bed
- Particle size: 0.5 to 1.0 mm beads (0.75 mm average)
- Feed air at 1.4 bar (g) (2.4 bar absolute), 25 degrees C, 8 LPM per bed
- Void fraction: 0.40
Step 1: superficial velocity. Cross-sectional area = pi * (0.040/2)^2 = 1.257e-3 m2. Air density at 2.4 bar 25 degrees C: rho = (2.4e5 * 29e-3) / (8.314 * 298) = 2.81 kg/m3. Volumetric flow at operating conditions = 8 LPM / 60 / 1000 * 1.013/2.4 = 5.63e-5 m3/s. Wait, that's wrong - the flow meter reads at atmospheric but the bed sees compressed air. So the actual flow entering the bed is 8 LPM * 1.013/2.4 = 3.37 LPM at bed conditions = 5.62e-5 m3/s. Superficial velocity v = 5.62e-5 / 1.257e-3 = 0.0447 m/s.
Step 2: Re_p. Air viscosity at 25 degrees C: 1.85e-5 Pa.s. Re_p = 2.81 * 0.0447 * 0.00075 / 1.85e-5 = 5.1. This is at the upper edge of the laminar-dominated regime, where both Ergun terms contribute roughly equally.
Step 3: Ergun calculation. Viscous term: (150 * 0.60^2 / 0.40^3) * (1.85e-5 * 0.0447 / 0.00075^2) = 1378 Pa/m. Inertial term: (1.75 * 0.60 / 0.40^3) * (2.81 * 0.0447^2 / 0.00075) = 439 Pa/m. Total = 1817 Pa/m = 1.82 kPa/m = 0.018 bar/m.
Step 4: total drop across the bed. 0.018 * 0.25 = 0.0046 bar. As a percentage of 1.4 bar (g) feed: 0.33 percent. This is well below the 8 percent ceiling. The fine 0.75 mm LiLSX beads generate only modest pressure drop because the bed is short and the flow is small. The actual constraint on this design is sieve life (LiLSX water sensitivity), not pressure drop.
What if the designer used 1.6 mm beads instead? Re-running the same calculation with dp = 0.0016 m: viscous term drops to 78 Pa/m, inertial term drops to 130 Pa/m, total = 208 Pa/m. Bed pressure drop falls to 0.05 kPa per bed, or 0.0007 percent of feed pressure. The trade-off: 1.6 mm LiLSX reaches equilibrium 30 to 50 percent slower than 0.75 mm, so the cycle time must be longer or the recovery suffers.
Worked Example 3: Compressed Air Dryer with Activated Alumina 2-5 mm
A heatless regenerative compressed air dryer operates at 7 bar (g) with twin towers. Each tower:
- Inside diameter: 200 mm
- Bed height: 500 mm
- Adsorbent: activated alumina 2 to 5 mm beads (3.5 mm average)
- Feed air: 7 bar (g), 35 degrees C, 35 Nm3/h per tower (1.0 m/s superficial)
- Void fraction: 0.42
Step 1: confirm superficial velocity. Cross-section = pi * (0.200/2)^2 = 0.0314 m2. Air density at 8 bar absolute 35 degrees C: rho = (8e5 * 29e-3) / (8.314 * 308) = 9.06 kg/m3. Volumetric flow at bed conditions = 35 Nm3/h * 1.013/8 * 308/273 = 5.0 m3/h = 0.00139 m3/s. Superficial velocity v = 0.00139 / 0.0314 = 0.0442 m/s. The 1.0 m/s in the spec was wrong - that's the line velocity at the inlet pipe, not the bed velocity.
Step 2: Re_p. Air viscosity at 35 degrees C: 1.88e-5 Pa.s. Re_p = 9.06 * 0.0442 * 0.0035 / 1.88e-5 = 75. Transitional regime - inertial term starting to matter.
Step 3: Ergun. Sphericity for alumina beads is approximately 0.85, so effective dp = 0.0035 * 0.85 = 0.00298 m. Viscous term: (150 * (0.58)^2 / (0.42)^3) * (1.88e-5 * 0.0442 / (0.00298)^2) = 1576 Pa/m. Inertial term: (1.75 * 0.58 / (0.42)^3) * (9.06 * 0.0442^2 / 0.00298) = 422 Pa/m. Total = 1998 Pa/m = 2.00 kPa/m = 0.020 bar/m.
Step 4: bed pressure drop. 0.020 * 0.5 = 0.010 bar. As percent of 7 bar (g) feed: 0.14 percent. Tiny. So the design is over-conservative on pressure drop. Either the bed could be shortened to 250 mm and still meet 0.07 percent drop, or the tower diameter could be reduced. In practice compressed air dryers are usually sized for breakthrough time (6 to 8 hours minimum cycle), not pressure drop.
Where pressure drop does become critical in compressed air dryers is regeneration. The expansion to atmosphere plus the purge flow causes high instantaneous velocities through the bed. If expansion is too fast the bed can lift or fluidize, which is a separate calculation from the steady-state Ergun prediction.
Worked Example 4: Hydrogen PSA with 5A Molecular Sieve 2 mm
A hydrogen purification PSA uses 5A molecular sieve to remove CO, CO2, CH4 from H2-rich feed. Conditions:
- Bed diameter: 800 mm
- Bed height: 3.5 m
- 5A molecular sieve 1.6 to 2.5 mm (2.0 mm average)
- Feed: H2-rich gas at 20 bar (g), 40 degrees C, 800 Nm3/h per bed
- Void fraction: 0.40
Step 1: velocity. Cross-section = pi * (0.800/2)^2 = 0.503 m2. Gas mixture density at 21 bar absolute 40 degrees C, assuming 90% H2 / 10% CO2: rho = (21e5 * (0.9 * 2 + 0.1 * 44) * 1e-3) / (8.314 * 313) = (21e5 * 6.2e-3) / 2602 = 5.00 kg/m3. Operating volumetric flow = 800 * 1.013/21 * 313/273 = 44.3 m3/h = 0.0123 m3/s. Superficial velocity v = 0.0123 / 0.503 = 0.0245 m/s.
Step 2: Re_p. Viscosity of H2-rich mixture at 20 bar 40 degrees C: approximately 1.40e-5 Pa.s. Re_p = 5.00 * 0.0245 * 0.002 / 1.40e-5 = 17.5. Still laminar-dominated.
Step 3: Ergun. Viscous term: (150 * (0.60)^2 / (0.40)^3) * (1.40e-5 * 0.0245 / 0.002^2) = 721 Pa/m. Inertial term: (1.75 * 0.60 / (0.40)^3) * (5.00 * 0.0245^2 / 0.002) = 39 Pa/m. Total = 760 Pa/m = 0.76 kPa/m = 0.0076 bar/m.
Step 4: total bed drop. 0.0076 * 3.5 = 0.0266 bar. As percent of 20 bar (g) feed: 0.13 percent. Almost negligible. The design is pressure-drop limited by other things - probably bed sizing for adsorption kinetics and cycle time, not Ergun.
This is typical of high-pressure hydrogen PSAs: pressure drop is rarely the binding constraint because the feed gas has low density and viscosity. The binding constraint is hydrogen recovery, which favors slow cycles and tall beds.
Particle Size Trade-Off: The Real Engineering Decision
The four worked examples above all came in well below the 5 to 8 percent drop limit. That is because most adsorbers are not pressure-drop limited at design flow. But particle size still matters for three other reasons that interact with pressure drop:
- Kinetics - smaller beads have shorter diffusion paths. A 1 mm bead reaches 90 percent of equilibrium in roughly 25 percent of the time a 2 mm bead needs in the same application. Faster kinetics means shorter cycles, higher recovery, smaller beds.
- Attrition and dust - smaller beads break more easily during loading and thermal cycling. Aluminaworld attrition test (ASTM D4058) shows that 1.6 to 2.5 mm molecular sieve loses 0.05 to 0.10 wt% per test cycle, while 0.5 to 1.0 mm beads lose 0.15 to 0.30 wt%. Fines end up at the bottom of the bed, partially blocking the support grid, raising pressure drop over time.
- Liquid contamination tolerance - larger beads tolerate occasional liquid slugs (compressor condensate, process upsets) better than small beads because the void space is larger. A 3 mm bead bed can survive a 50 mL water slug without waterlogging; a 1 mm bed cannot.
| Particle size (mm) | Typical application | Bed dP/m at 0.1 m/s (air, 25°C, 1 bar) | Pros | Cons |
|---|---|---|---|---|
| 0.5-1.0 | Lab-scale, fine polishing, fast cycles | 5-12 kPa/m | Fastest kinetics, smallest beds | Highest dP, highest attrition, liquid-sensitive |
| 1.6-2.5 | PSA oxygen, hydrogen, biogas | 1.0-2.5 kPa/m | Good kinetics, moderate dP | Moderate attrition, some liquid sensitivity |
| 3.0-5.0 | Natural gas dehydration, large air dryers, CO2 removal | 0.2-0.6 kPa/m | Lowest dP, robust to liquids | Slower kinetics, larger beds needed |
Decision rule for particle size: if you can reduce bed height by 50 percent by going from 3 mm to 1.6 mm, you will save money on vessel cost even though sieve cost per kilogram is similar. But if your feed gas has liquid contamination risk (compressor lube, glycol carryover, hydrates), stay at 3 mm or larger. Aluminaworld's most common sieve grade for PSA is 1.6 to 2.5 mm. For natural gas dehydration it is 3 to 5 mm. For compressed air drying it is 2 to 5 mm activated alumina.
Minimum Fluidization: The Hard Upper Velocity Limit
Below a certain superficial velocity the bed sits still and pressure drop follows Ergun. Above that velocity the particles lift and the bed fluidizes - pressure drop drops to the buoyant weight per unit volume and stays there, regardless of velocity. This is the minimum fluidization velocity Umf, and it sets a hard upper limit on operating velocity.
For 5A molecular sieve 3 mm beads in air at 25 degrees C, Umf is approximately 0.65 m/s. Industrial design uses 60 to 70 percent of Umf as the operating ceiling, so 0.40 to 0.45 m/s. For 1 mm beads Umf drops to about 0.10 m/s and the safe limit is 0.06 to 0.07 m/s. Operating above Umf causes:
- Particle movement and inter-particle abrasion
- Bed compaction (the bed settles to a higher density after fluidization)
- Top sieve plate or screen damage from impact
- Fines migration and support grid blocking
The Ergun equation can be inverted to find Umf by setting dP/L = (rho_particle - rho_gas) * (1 - eps) * g. Solving for v gives Umf. For most industrial adsorbers the practical operating velocity is 30 to 60 percent of Umf, which keeps the bed well away from fluidization while maintaining good mass transfer kinetics.
Wall Effects: Why Small Pilot Columns Behave Differently
If you scale a process from a 50 mm pilot column to a 1 m production tower, you cannot simply multiply pressure drop by the diameter ratio. Wall effects in small columns force the flow to redistribute near the wall, where the void fraction is higher (less compaction near the rigid wall). This actually reduces the average pressure drop, but the prediction gets less reliable.
The standard rule: vessel-to-particle diameter ratio D/dp must be greater than 20 for the Ergun equation to apply within 10 percent. For dp = 2 mm, D must be at least 40 mm - so a 50 mm pilot column is acceptable. For dp = 0.5 mm, D must be at least 10 mm, but most pilot work at this size uses 25 to 50 mm columns, so the rule is comfortably met.
The danger zone is very small columns (10 to 20 mm) with very fine particles (0.1 to 0.5 mm), used in laboratory microreactor studies. Here wall effects dominate and the Ergun equation over-predicts pressure drop by 20 to 50 percent. Always cite your D/dp ratio when publishing pilot data, otherwise the values cannot be reliably scaled up.
Pressure Drop Increase Over Service Life
A fresh bed follows the Ergun prediction closely. After 6 to 36 months in service, pressure drop rises. Four mechanisms contribute:
- Fines accumulation - attrition dust, broken beads, and feed contaminants migrate downward and partially block the support screen or bottom layer. A 5 to 30 percent pressure drop increase is typical after 1 to 3 years. The fix is a bottom-layer of larger beads (6 to 10 mm alumina balls) that acts as a dust filter, or periodic back-pulsing of the bed.
- Liquid contamination - compressor lube oil carryover, glycol from upstream contactors, or process upsets coat particles with a film that effectively reduces void fraction. A 10 to 100 percent pressure drop increase is possible within weeks of a contamination event. The fix is upstream filtration - a coalescing filter ahead of the dryer in air service, a glycol scrubber in gas service.
- Hydrate or salt formation - in natural gas service, hydrates and salts (NaCl, CaCO3 from formation water) can precipitate in inter-particle voids and cement the bed. A 50 to 200 percent pressure drop rise is possible if the inlet temperature drops below the hydrate point. The fix is upstream dehydration or methanol injection.
- Bed settlement and compaction - thermal cycling and vibration slowly compact the bed by 2 to 4 percent, slightly reducing void fraction. This adds about 5 percent to pressure drop over the bed lifetime. The fix is annual top-up of sieve to the design level.
A pressure drop rise of more than 20 percent from baseline is a clear signal to investigate. Log differential pressure continuously and trend monthly. A slow upward drift is normal wear; a sudden spike is a process upset that needs root-cause analysis.
Standards, Codes, and References
Several international standards apply to adsorbent bed pressure drop measurement and calculation:
- ASME PTC 19.5 - Flow Measurement (used for orifice and nozzle calibration that indirectly sets pressure drop test methodology)
- ISO 4006 - Measurement of gas flow in closed conduits (applies to test rigs for adsorbent pressure drop characterization)
- ASTM D4058 - Standard Test Method for Attrition and Abrasion of Catalysts and Catalyst Carriers (used by Aluminaworld for sieve attrition, which links to fines accumulation)
- ASTM D5028 - Standard Test Method for Coking Value of Tar and Pitch (modified in industry for measuring volatile content of activated alumina)
- ISO 13320 - Particle size analysis by laser diffraction (used for sieve particle size distribution, which feeds directly into Ergun)
- ISO 9277 - Determination of the specific surface area of solids by gas adsorption - BET method (used for sieve surface area specification)
- UOP 874 - Attrition of Molecular Sieves (Aluminaworld follows this in addition to ASTM D4058 for 13X and 5A grades)
- Ergun, S. (1952) - Fluid flow through packed columns. Chemical Engineering Progress, 48, 89-94. The original paper.
For the underlying fluid mechanics, see also: McCabe, Smith and Harriott, Unit Operations of Chemical Engineering, 7th ed., Chapter 6 (flow through packed beds); Perry's Chemical Engineers' Handbook, 9th ed., Section 6 (fluid and particle dynamics); and the original Ergun paper for the derivation.
A Quick Calculator Worksheet
For engineers who want to run their own numbers, here is a step-by-step worksheet that you can replicate in Excel or Python in 10 minutes:
Inputs:
  D_vessel (m)            = ?
  L_bed (m)               = ?
  dp_particle (m)         = ?        (sieve mean size)
  phi_sphericity          = 0.85-0.95
  eps_void_fraction       = 0.38-0.45
  T_feed (K)              = ?
  P_feed_abs (Pa)         = ?
  MW_gas (g/mol)          = ?
  Q_flow (Nm3/s)          = ?
  mu_gas (Pa.s)           = ?

Convert dp to effective:    dp_eff = dp * phi
Compute operating density:  rho = P * MW / (8.314 * T)
Compute operating flow:     Q_op = Q_flow * 1.013e5 / P * T / 273
Compute superficial vel:    v = Q_op / (pi * (D_vessel/2)^2)
Compute Re_p:               Re_p = rho * v * dp_eff / mu

Ergun:
  dP_visc_L = 150 * (1-eps)^2 / eps^3 * mu * v / dp_eff^2
  dP_inert_L = 1.75 * (1-eps) / eps^3 * rho * v^2 / dp_eff
  dP_total_L = dP_visc_L + dP_inert_L     [Pa/m]
  dP_total   = dP_total_L * L_bed         [Pa]

Convert:    dP_bar = dP_total / 1e5
            dP_percent = dP_bar / (P_feed_abs/1e5 - 1.013) * 100

Check:
  - dP_percent < 8%?  -> OK
  - v < 0.6 * Umf?    -> OK
  - D_vessel / dp_eff > 20?  -> OK
Aluminaworld can run this calculation on your specific lot of sieve and feed gas composition free of charge. Just send us your operating conditions (vessel dimensions, flow, pressure, temperature, gas composition) and the sieve grade and we will return a pressure drop and fluidization analysis within two business days.
Aluminaworld Sizing Support
For engineers who want a sieve vendor to back-calculate the bed design, Aluminaworld provides three levels of support:
- Lot-level data sheet - every shipment includes particle size distribution (sieve analysis), bulk density, attrition (ASTM D4058), and crush strength. These are the four Ergun inputs.
- Free sizing calculation - send us your feed conditions and target outlet specification, we will return recommended bed dimensions, sieve grade, and particle size distribution.
- Custom particle size - if the design calls for non-standard PSD (e.g., 0.8 to 1.2 mm for a high-purity polishing bed), we can manufacture to your spec with 5 kg MOQ for pilot work and 500 kg MOQ for production.
| Sieve grade | Standard sizes (mm) | Custom range available (mm) | Bulk density (g/L) | Crush strength (N/bead) | Attrition (wt%, ASTM D4058) |
|---|---|---|---|---|---|
| 3A molecular sieve | 1.6-2.5, 3.0-5.0 | 0.5-1.0 to 4.0-6.0 | 700-750 | 30-80 | 0.05-0.10 |
| 4A molecular sieve | 1.6-2.5, 3.0-5.0 | 0.5-1.0 to 4.0-6.0 | 700-750 | 30-80 | 0.05-0.10 |
| 5A molecular sieve | 1.6-2.5, 3.0-5.0 | 0.5-1.0 to 4.0-6.0 | 700-750 | 30-80 | 0.05-0.10 |
| 13X molecular sieve | 1.6-2.5, 3.0-5.0 | 0.5-1.0 to 4.0-6.0 | 650-700 | 25-60 | 0.05-0.15 |
| Activated alumina | 1-3, 2-5, 3-5, 4-6, 5-7 | 0.5-1.0 to 6.0-8.0 | 750-850 | 80-150 | 0.03-0.08 |
| Activated alumina (pellet) | 3-5, 4-6 | 2-4 to 5-7 | 700-800 | 60-120 | 0.05-0.10 |
7 Common Mistakes When Sizing Adsorbent Beds
- Using atmospheric-pressure gas density in a high-pressure adsorber. The methane density at 70 bar is 80 times higher than at 1 bar. Get this wrong and your Ergun result is off by an order of magnitude.
- Using average particle size instead of effective size. For non-spherical particles (extrudates, pellets), effective dp = dp_geometric * sphericity. Alumina pellets at sphericity 0.75 give 25 percent lower effective dp than their geometric size suggests.
- Ignoring temperature rise from heat of adsorption. Water adsorption on activated alumina releases about 50 kJ/mol. Over the mass transfer zone the bed can warm 10 to 25 degrees C. Use average bed temperature, not inlet temperature, in the Ergun calculation.
- Operating above minimum fluidization velocity. Sometimes the bed pressure drop looks "fine" at 0.5 m/s superficial velocity because the particles have already lifted and the bed is fluidized. This destroys the bed within weeks.
- Mixing particle sizes in the same bed. Smaller particles migrate to the bottom over time, segregating the bed by size and creating a high-pressure-drop layer at the support. Either use a single size or design with explicit size layers.
- Not allowing for wall effects in pilot columns. A 25 mm pilot column with 1 mm particles has D/dp of 25 - just barely above the Ergun validity limit. Pressure drop predictions are off by 10 to 20 percent. Use larger pilot columns when possible.
- Forgetting the support screen pressure drop. The screen or perforated plate at the bottom adds 5 to 15 percent to total pressure drop. For fine-mesh screens (100 to 200 mesh) the contribution can be 30 percent. Always include this in the total.
Frequently Asked Questions
What is the Ergun equation and why is it used for adsorbent bed pressure drop?
The Ergun equation (1952, Chemical Engineering Progress) is the standard empirical correlation for predicting pressure drop across a packed bed of solid particles. It combines a viscous (laminar) term and an inertial (turbulent) term: dP/L = (150 * (1-eps)^2 / eps^3) * (mu * v / dp^2) + (1.75 * (1-eps) / eps^3) * (rho * v^2 / dp). Here mu is gas viscosity, v is superficial velocity, dp is particle diameter, rho is gas density, and eps is bed void fraction (typically 0.35 to 0.45 for spherical adsorbent beads). The Ergun equation is accurate to within plus or minus 20 percent for Re_p between 1 and 1000, which covers virtually every commercial PSA and TSA adsorbent bed. It is the basis for ASME PTC 19.5 flow calibration and ISO 4006 packed bed test methodology.
How much pressure drop is acceptable across an adsorbent bed?
Industry rule of thumb: total bed pressure drop should not exceed 5 to 8 percent of the absolute feed pressure. For a 7 bar (g) compressed air dryer this means 0.35 to 0.55 bar maximum across both towers during adsorption. For a 1.5 bar (g) PSA oxygen unit the limit is 0.075 to 0.12 bar. Exceeding these values wastes compressor work, raises regeneration energy, and accelerates sieve attrition through vibration. For a single tower, 1.5 to 3.0 kPa per meter of bed height is a typical design target, depending on particle size.
Does smaller particle size always increase pressure drop?
Yes, in the laminar flow regime (Re_p below 10) pressure drop scales inversely with particle diameter squared. Halving particle size from 3 mm to 1.5 mm quadruples the pressure drop. In the turbulent regime (Re_p above 100) the scaling is closer to inverse with particle diameter to the first power. The trade-off is kinetic performance: 1.5 mm beads reach 90 percent of equilibrium water capacity in 15 to 30 minutes while 3 mm beads need 60 to 120 minutes in the same application. Engineers balance this by using larger particles for bulk drying and smaller particles for high-purity polishing.
How do I calculate bed pressure drop for a molecular sieve 4A natural gas dryer?
A typical design: 4A molecular sieve 3 to 5 mm beads, bed diameter 1.5 m, bed height 4.0 m, feed gas at 40 bar (g) and 35 degrees C, superficial velocity 0.10 m/s, void fraction 0.38. Viscosity of methane at 40 bar is about 1.3e-5 Pa.s, density 28 kg/m3. Re_p = rho*v*dp/mu = 28*0.10*0.004/1.3e-5 = 862. The Ergun equation gives dP/L = (150*(0.62)^2/(0.38)^3)*(1.3e-5*0.10/(0.004)^2) + (1.75*(0.62)/(0.38)^3)*(28*0.10^2/0.004) = 1029 + 6182 = 7211 Pa/m. Total bed drop = 7211 * 4 = 28844 Pa = 0.29 bar. That is 7.2 percent of the 40 bar feed pressure, within the 5 to 8 percent guideline.
What bed void fraction should I use for spherical adsorbent beads?
For uniform spherical beads poured randomly into a vertical vessel, the bed void fraction (eps) is 0.38 to 0.42. For 1.6 to 2.5 mm molecular sieve beads the typical design value is 0.40. For irregular crushed particles like 1 to 3 mm activated alumina, expect 0.42 to 0.46 due to poorer packing geometry. Pellets and extrudates (3 to 5 mm cylinders) pack at 0.36 to 0.40. Always measure the actual poured density of the specific sieve grade and back-calculate void fraction rather than using textbook numbers.
Can I use the Ergun equation for air dryer regeneration flow as well?
Yes. The same equation applies in both directions. During TSA regeneration of a compressed air dryer the purge gas is hot (180 to 220 degrees C) and at near-atmospheric pressure. Viscosity of air at 200 degrees C is roughly 2.6e-5 Pa.s (about 25 percent higher than at 25 degrees C) and density drops to 0.75 kg/m3. Re_p drops by roughly 60 percent compared to room-temperature adsorption. Bed pressure drop during regeneration is therefore typically 30 to 50 percent lower than during adsorption at the same volumetric flow rate. Be aware that the much lower gas density in regeneration can also push the system into the laminar-dominated regime, which is the worst case for fine-particle pressure drop.
How does bed diameter to particle diameter ratio affect pressure drop?
When the vessel diameter is less than 20 times the particle diameter, wall effects increase pressure drop and cause flow channeling. ASME PTC 19.5 and most engineering references recommend a D/dp ratio of at least 20:1, preferably 30:1 or higher. For a 1.6 mm molecular sieve the minimum vessel diameter is 32 mm, ideally 50 mm or more. Below the 20:1 threshold the Ergun equation over-predicts pressure drop by 5 to 15 percent because the wall constraint reduces the effective void fraction near the wall. For pilot columns with 25 to 50 mm diameter this can be a real issue, especially with 0.5 to 1 mm fine particles.
Why does bed pressure drop increase over time in service?
Pressure drop in a fresh bed is the Ergun baseline. Over time, four mechanisms add to it: (1) fines accumulation - attrition dust migrates to the bottom and partially blocks the support grid, adding 5 to 30 percent pressure drop after 1 to 3 years; (2) liquid contamination - compressor lube oil, glycol carryover, or process upsets coat particles and reduce effective void fraction; (3) hydrate or salt formation - in natural gas service hydrates and salt deposits can fill inter-particle voids; (4) bed settlement and packing - mechanical vibration and thermal cycling compact the bed by 2 to 4 percent, slightly reducing void fraction and raising drop. A pressure drop increase of more than 20 percent from baseline is a clear signal to inspect the bed for fines, contamination, or breakage.
How do I measure actual bed pressure drop in the field?
Install two calibrated pressure transmitters (or high-quality gauges) at the inlet and outlet of each adsorbent tower. Use differential pressure transmitters with at least 0.1 percent of full-span accuracy and a turndown ratio appropriate to the expected drop. Take the reading only during the steady-state portion of the adsorption half-cycle, not during the pressure-build or blowdown steps. Measure at three operating conditions - design feed pressure, design flow, and 110 percent of design flow - and compare to the Ergun prediction. A discrepancy of more than plus or minus 25 percent indicates either packing problems, contamination, or measurement error. Always log DP continuously and trend it monthly; a slow upward drift is an early indicator of fines accumulation.
What is the maximum operating velocity before fluidization in an adsorbent bed?
The minimum fluidization velocity (Umf) is calculated from the Ergun equation by setting the pressure drop equal to the buoyant weight per unit volume of the bed. For 4A molecular sieve 3 mm beads in air at 25 degrees C, Umf is approximately 0.65 m/s. Industrial practice is to operate at no more than 60 to 70 percent of Umf, so a maximum operating superficial velocity of 0.40 to 0.45 m/s. For finer 1 mm beads Umf drops to about 0.10 m/s and the safe operating limit is 0.06 to 0.07 m/s. Exceeding Umf causes particle movement, attrition, and eventual bed compaction - so fluidization velocity sets a hard upper ceiling on flow rate regardless of pressure drop.
Next Steps for Your Adsorbent Bed Design
If you are designing, scaling up, or troubleshooting an adsorbent bed, the Ergun calculation is the foundation that ties together particle size, vessel dimensions, gas properties, and operating limits. The four worked examples in this guide should give you a working template; the table of sieve properties should help you set the inputs; the common-mistakes section should help you avoid the traps that catch first-time designers.
For a sieve supplier-side calculation - what particle size and bed dimensions make sense for your specific gas composition, flow, and purity target - reach out to the Aluminaworld technical team.
- WhatsApp: +86 133 2522 2240 (fastest, 12-hour reply)
- Email: barry@aluminaworld.com
- Sample request: 5 kg R&D pack of any sieve grade, 5-7 day lead time, full CoA included
- Bulk orders: 500 kg MOQ, 15-20 day production, FOB/CIF/CFR from Qingdao Port (80 km from our factory)
- Custom particle size: 5 kg MOQ pilot, 500 kg MOQ production, 4-6 week lead time for non-standard PSD
Aluminaworld has supplied molecular sieve and activated alumina to PSA, TSA, and compressed air dryer manufacturers in 60+ countries for 15 years. Our sieve is manufactured under ISO 9001 quality control with SGS on-site audits and full Alibaba Trade Assurance. Send us your feed conditions, vessel dimensions, and target outlet spec - we will return a recommended sieve grade, particle size, and bed design within two business days.
Related Products & Resources
Need a Pressure Drop Calculation for Your Bed?
Send us your vessel dimensions, flow rate, gas composition, and target purity. We will return a recommended sieve grade, particle size, and Ergun prediction within two business days.