Why Layer-by-Layer Sectioning Beats Single-Point Sampling
A molecular sieve bed is not a homogeneous reactor. It is a packed column with strong axial gradients in composition, temperature and activity. The top of the bed sees fresh feed at the highest contaminant concentration; the bottom sees clean raffinate at near-equilibrium moisture. Regeneration gas flows in the opposite direction, so the bottom of the bed is the first to heat and the last to cool, while the top is the first to desorb and the last to re-adsorb. These counter-current flows create three distinct zones in a working bed, and each zone ages differently.
Single-point sampling treats the bed as a black box and reports an average. The average of a healthy bed and a bed with a 10x contamination spike in the top 200 mm can be numerically identical, even though one bed has 8 years of life remaining and the other has 8 months. The only way to expose the gradient is to physically section the bed and analyse each layer. The protocol described here produces a 5-point vertical profile in a single turnaround afternoon, with all analyses runnable at most commercial adsorbent QC labs.
Three diagnostic benefits make the protocol worth the effort. First, the shape of the contamination profile localises the root cause. A sharp spike in the top layer points to upstream carryover; a smooth gradient points to regeneration breakthrough; a flat profile with low values across all layers points to normal end-of-life attrition. Second, the magnitude of the gradient estimates remaining life. A top layer at 2.0 wt percent carbon on a bed with bottom layer at 0.2 wt percent has a 10:1 gradient and a working mass transfer zone of approximately 40 percent of the bed height; the bed is failing now. A 3:1 gradient with top at 0.6 wt percent and bottom at 0.2 wt percent has a 20 percent working zone and 2-3 years of life remaining. Third, the analytical data generates an audit trail that satisfies insurance, HSE, and vendor-warranty requirements.
5-Step Sectioning Protocol for a Pressurised Molecular Sieve Bed
The protocol assumes the sectioning is scheduled during a planned turnaround, with the vessel fully depressurised, isolated, N2-purged, and accessible through the top manway. Do not attempt sectioning on a live bed. The protocol is broken into five steps covering access, sampling, sample handling, analytical panel, and reporting.
Step 1 - Pre-job preparation (2-3 days before turnaround). Confirm the vessel is on the turnaround scope with the operations and planning groups. Identify the sample layers: top 0-200 mm, upper-middle 200-800 mm, middle 800-2000 mm, lower-middle 2000-4000 mm, and bottom 4000+ mm. For shallow beds below 3 m, use 3 layers (top, middle, bottom). Order 5 stainless steel sample containers with airtight lids (500 mL or 1 L), 5 zip-lock bags for duplicates, 5 sample labels pre-printed with vessel ID, layer, date, and operator, and a stainless steel thief probe of 25-50 mm diameter and at least 1.5 m length. Brief the lab on the expected analytical panel so they can schedule instrument time.
Step 2 - Vessel access and safe entry (1-2 hours after depressurisation). Lock out the inlet and outlet block valves, vent the vessel to atmospheric through the vent line, and purge with N2 to below 1 percent O2 by volume (verify with a 4-gas monitor). Install a working platform if the top manway is above 2 m from grade. Open the top manway. Allow the bed to cool below 40 C before entry; do not sample hot sieve, as the moisture reading will be biased by desorption during sample handling. Confirm the top surface is level and free of standing liquid before sampling. If standing liquid is present (condensate, lube oil, or process fluid), photograph it, measure its volume, sample it separately, and add the finding to the report - it is diagnostic in its own right.
Step 3 - Core sampling at each layer (2-4 hours). Take the top sample first, working from the centre of the top surface downward with the thief probe. For each layer, lower the probe to the target depth, drive it 100-200 mm into the bed with a steady push, withdraw, and transfer the core to the labelled container. Seal the container within 60 seconds to minimise moisture exchange with ambient air. Repeat at three radial positions per layer (centre, half-radius, near-wall) and combine into one composite per layer, or keep them separate for a radial profile. The 3-position composite is the minimum; the 5-position composite is preferred for beds above 4 m diameter. Bottom samples are taken through the bottom manway if accessible, or by digging down from the top with a long probe - the bottom manway is faster when available.
Step 4 - Sample handling and chain of custody (30 min). Label each container with vessel ID, layer, sample date, operator initials, and time. Store at room temperature; do not refrigerate. Transport to the lab within 24 hours. If a litigation hold is possible (warranty dispute, insurance claim, environmental release), prepare duplicate samples per layer and store one set in a locked cabinet under chain-of-custody documentation. A typical chain-of-custody form captures sample ID, collector, collection date/time, transfer date/time, receiving analyst, and disposal date. This is overkill for routine turnarounds but standard practice when the failure is contested.
Step 5 - Analytical panel and turnaround (3-7 days). Run the priority panel within 24 hours of receipt: Karl Fischer moisture (ASTM D6869 or equivalent), bulk loss-on-ignition at 1000 C (ASTM D7341 modified), BET surface area by N2 physisorption (ASTM D3663), and total carbon and sulphur by LECO induction furnace. Run the secondary panel within 7 days: extractable hydrocarbons by Soxhlet with dichloromethane, ion chromatography for chloride and sulphate on a water extract, ICP-OES for iron, sodium, calcium, magnesium, vanadium, and nickel after acid digestion, and ASTM D4058 attrition on a 50 g subsample. Plot the results as bar charts with layer on the x-axis and each parameter on the y-axis before drawing a diagnosis.
Anatomy of a Healthy Type 13X Natural Gas Dehydration Bed Profile
Before interpreting a spent bed, you need a baseline. Table 1 shows the typical 5-layer profile for a Type 13X molecular sieve bed that has run 2-3 years on sales-quality natural gas (H2S < 4 ppmv, water dew point < -20 C at 70 barg) with proper regeneration.
| Layer | Moisture (wt%) | Carbon (wt%) | Sulphur (wt%) | Iron (ppmw) | Surface area (m2/g) | Attrition (wt%) |
|---|---|---|---|---|---|---|
| Top 0-200 mm | 0.8-1.5 | 0.4-0.8 | 0.05-0.15 | 30-50 | 620-680 | 0.20-0.40 |
| Upper-middle 200-800 mm | 0.6-1.0 | 0.2-0.4 | 0.02-0.06 | 15-30 | 660-700 | 0.10-0.20 |
| Middle 800-2000 mm | 0.4-0.7 | 0.1-0.2 | < 0.02 | < 15 | 680-720 | 0.05-0.10 |
| Lower-middle 2000-4000 mm | 0.3-0.5 | < 0.1 | < 0.02 | < 10 | 700-720 | < 0.05 |
| Bottom 4000+ mm | 0.2-0.4 | < 0.1 | < 0.01 | < 10 | 700-720 | < 0.05 |
Three patterns are diagnostic of a healthy bed. First, the top-to-bottom carbon gradient is 3:1 to 5:1. Second, the top-to-bottom surface-area gradient is < 15 percent, with the top layer still within 8-12 percent of fresh-sieve BET. Third, iron and sulphur are detectable only in the top layer. Anything significantly outside these ranges is a flag for one of the failure modes discussed in the next section.
The moisture values in Table 1 are 'as-sampled' from a depressurised bed. The numbers will be higher than the in-service moisture because the bed has been cooling for 12-48 hours between depressurisation and sampling, and the lower layers re-adsorb moisture from the rising N2 purge stream. To compare against in-service conditions, take a sealed sample with a heated probe and analyse moisture within 30 minutes. The other parameters (carbon, sulphur, iron, surface area, attrition) are stable on the time scale of a turnaround and can be run days later without bias.
Case Study 1: Sour-Gas Type 13X Bed with Corroded Upstream Scrubber
A Middle Eastern gas plant running a 14-tonne Type 13X dehydration bed in parallel with an upstream gas-gas heat exchanger started seeing rising outlet dew point after 18 months. The CoA on the original sieve showed 720 m2/g BET and 0.1 wt percent LOI. Operators increased regeneration temperature from 260 C to 290 C with no improvement. The vendor warranty inspection was triggered at month 22 when the bed failed the 7 lb/MMscf sales-gas water spec consistently.
The turnaround sectioning protocol was run during a planned outage. The 5-layer profile is summarised in Table 2. The top layer showed a sharp spike in iron (340 ppmw, 7x the normal top-layer value) and sulphur (0.6 wt percent, 4x normal). Carbon was elevated at 1.4 wt percent but distributed in the top 400 mm only, with the middle and bottom layers at fresh-sieve values. Surface area was 580 m2/g in the top 200 mm and recovered to 700 m2/g by the middle layer.
| Layer | Carbon (wt%) | Sulphur (wt%) | Iron (ppmw) | Chloride (ppmw) | Surface area (m2/g) |
|---|---|---|---|---|---|
| Top 0-200 mm | 1.4 | 0.60 | 340 | 85 | 580 |
| Upper-middle 200-800 mm | 0.4 | 0.10 | 85 | 30 | 680 |
| Middle 800-2000 mm | 0.1 | 0.02 | 20 | 10 | 710 |
| Lower-middle 2000-4000 mm | < 0.1 | < 0.01 | < 10 | < 5 | 715 |
| Bottom 4000+ mm | < 0.1 | < 0.01 | < 10 | < 5 | 720 |
The diagnosis was a localised iron-sulphide deposition event driven by upstream corrosion. The chloride co-spike (85 ppmw in the top layer, 7x normal) confirmed the corrosion source was chloride-induced, most likely from a leaking heat exchanger downstream of a salt-water cooling section. The bed was a victim of upstream equipment failure, not a regeneration problem. The corrective action was to replace the corroded scrubber internals, install an online iron-inlet monitor, and accept a partial-bed top-zone change-out rather than a full re-bed.
The diagnostic that single-point sampling would have missed: the sharp top-layer spike in iron and chloride is invisible in a single composite sample. The composite reads as 'moderate iron contamination, moderate chloride, slightly elevated carbon' and the engineer wastes a turnaround chasing a regeneration problem that does not exist. The 5-layer profile localises the issue to the top 200 mm and provides the chloride signature that points to upstream corrosion.
Case Study 2: Ethylene-Cracking Type 3A Dryer with Regeneration Breakthrough
A Gulf Coast petrochemical complex running two parallel Type 3A dryers on ethylene cracker off-gas started failing the -60 C dew-point spec after 14 months. The 3A sieve was rated for 3-year life; the failure was a clear out-of-spec event. Operators blamed feed carryover of compressor lube (the crackers had a new compressor with a known seal issue). The turnaround sectioning was scheduled to confirm the lube hypothesis before committing to a compressor overhaul.
The 5-layer profile is summarised in Table 3. The pattern was a smooth carbon gradient with peak carbon at 1.2 wt percent in the top layer, decaying to 0.4 wt percent at the middle, 0.1 wt percent at the bottom. Sulphur and iron were below detection in all layers. Lube oil markers (calcium, zinc, phosphorus by ICP-OES) were below 5 ppmw in all layers. The carbon desorption TGA peak was at 540 C, in the 400-700 C window characteristic of regeneration breakthrough, not at 200-300 C as lube oil would produce.
| Layer | Carbon (wt%) | Iron (ppmw) | Calcium (ppmw) | Surface area (m2/g) | TGA peak (C) |
|---|---|---|---|---|---|
| Top 0-200 mm | 1.20 | < 10 | 3 | 540 | 540 |
| Upper-middle 200-800 mm | 0.80 | < 10 | 2 | 600 | 520 |
| Middle 800-2000 mm | 0.40 | < 10 | 2 | 650 | 490 |
| Lower-middle 2000-4000 mm | 0.10 | < 10 | 1 | 680 | 460 |
| Bottom 4000+ mm | 0.10 | < 10 | 1 | 690 | 440 |
The diagnosis was regeneration breakthrough. The smooth gradient and the high TGA peak temperature ruled out lube oil carryover. The cause was traced to a regeneration gas dryer that was no longer drying the regeneration gas adequately - the regeneration gas was delivering 200 ppmv water to the bed instead of < 10 ppmv, so the bed could never fully desorb. The corrective action was to overhaul the regeneration gas dryer and replace the bed; the compressor seal was not the issue and the proposed compressor overhaul was cancelled.
The diagnostic that single-point sampling would have missed: a single composite sample from this bed would have read '0.5 wt percent carbon, no iron, no chloride, no lube markers' and the engineer would have either written it off as normal end-of-life or guessed wrong at lube carryover. The 5-layer profile is what reveals the smooth gradient as a regeneration signature, and the TGA peak temperature is what discriminates regeneration breakdown from feed carryover.
Five Failure Modes and Their Layer-Profile Signatures
Across 30+ diagnostic case studies we have reviewed at AluminaWorld technical service, five distinct failure modes account for 95 percent of premature bed replacements. The layer profile is the primary tool for discriminating between them, supplemented by the analytical panel described in the protocol.
Failure mode 1 - Liquid carryover slug. Signature: sharp spike in carbon, iron, and sodium in the top 100-200 mm only, with middle and bottom layers at fresh-sieve values. Standing liquid visible on top of the bed during sectioning. Cause: failed inlet scrubber, slug from upstream separator, or sudden process upset dumping liquid into the bed. Fix: replace the scrubber internals and accept a top-zone change-out.
Failure mode 2 - Compressor lube carryover. Signature: smooth carbon gradient top to bottom, with elevated calcium and zinc (200-1000 ppmw) in all layers and phosphorus detectable above 50 ppmw. TGA peak at 200-300 C characteristic of lube base oil. Cause: worn compressor seals or coalescer failure. Fix: overhaul the compressor seals and replace the coalescer; bed must be fully changed because lube is distributed throughout.
Failure mode 3 - Regeneration breakthrough. Signature: smooth carbon gradient, no iron, no chloride, no lube markers, TGA peak at 400-700 C. Cause: insufficient regeneration temperature, insufficient regeneration time, valve leakage on the regen-gas line, or regeneration gas not dry enough. Fix: overhaul the regen-gas system; bed may be salvageable if surface area is still > 80 percent of fresh.
Failure mode 4 - Coke polymerisation from acid exposure. Signature: high carbon (> 1.5 wt percent) localised in the top half of the bed, with elevated chloride or sulphate in the same zone, brown-to-black discolouration visible on bead surfaces. Cause: HCl or SO2 carryover from upstream acid-gas treating, polymerises during regeneration. Fix: replace the upstream acid-gas contactor packing; bed must be fully changed.
Failure mode 5 - Normal end-of-life attrition. Signature: top-to-bottom gradient < 3:1, top-layer attrition > 1.0 wt percent by ASTM D4058, surface area loss < 15 percent throughout, no unusual contaminants. Cause: 3-5 years of normal thermal cycling, expected replacement. Fix: full bed change with fresh sieve; no upstream action required.
Three secondary parameters refine the diagnosis. Iron above 100 ppmw in the top layer points to upstream corrosion regardless of the primary signature. Chloride above 50 ppmw in the top layer points to upstream acid-gas carryover or salt-water contamination. Sodium above 200 ppmw in the top layer points to upstream amine or caustic carryover from gas treating. None of these are fixable by changing the bed - they are all upstream equipment problems.
Reporting Template for the Turnaround Sectioning
Layer profile data is only useful if it is reported in a format that survives an audit. A defensible report has three sections: the sample log, the analytical results table, and the diagnosis narrative. The sample log captures vessel ID, vessel service, bed age at sectioning, sample layers, sample dates, sample operators, and chain of custody. The analytical results table is a 5-layer by 7-parameter matrix with method citations. The diagnosis narrative is a 200-400 word free-text section that interprets the profile, identifies the most likely root cause, and lists the corrective actions in priority order.
Table 4 shows a template that has been used successfully in plant turnaround reports for over a decade. The seven priority parameters are moisture, carbon, sulphur, iron, chloride, surface area, and attrition; the secondary parameters are sodium, calcium, zinc, phosphorus, vanadium, nickel, and silicon. The diagnosis column is short by design - one line per layer, pointing to the dominant feature. The corrective action column is the engineer's recommendation, sequenced by priority.
| Layer | Moisture (KF, ASTM D6869) | Carbon (LECO, ASTM D7341) | Sulphur (LECO) | Iron (ICP-OES, ASTM D6357) | Surface area (BET, ASTM D3663) | Diagnosis |
|---|---|---|---|---|---|---|
| Top 0-200 mm | __ wt% | __ wt% | __ wt% | __ ppmw | __ m2/g | [localised spike / smooth gradient / flat] |
| Upper-middle 200-800 mm | __ wt% | __ wt% | __ wt% | __ ppmw | __ m2/g | [matching / diverging] |
| Middle 800-2000 mm | __ wt% | __ wt% | __ wt% | __ ppmw | __ m2/g | [reference / baseline] |
| Lower-middle 2000-4000 mm | __ wt% | __ wt% | __ wt% | __ ppmw | __ m2/g | [clean / contaminated] |
| Bottom 4000+ mm | __ wt% | __ wt% | __ wt% | __ ppmw | __ m2/g | [reference baseline] |
The diagnosis narrative should answer four questions explicitly. Which failure mode is the bed in? What is the upstream equipment or operating condition that caused it? What is the corrective action, sequenced by priority and cost? What is the predicted remaining life if no action is taken and the bed is left in service? The narrative is the section that survives an audit; the data table is supporting evidence.
Sampling Pitfalls: Five Mistakes That Invalidate the Profile
The protocol is straightforward but the execution is unforgiving. Five common mistakes produce misleading profiles and wasted turnaround time. Recognising them in advance saves the diagnostic.
Mistake 1 - Sampling through side nozzles. Side nozzles on molecular sieve vessels are process connections for the inlet, outlet, and regeneration gas. They do not give vertical profiles. Sampling through a side nozzle at the top head gives you material from the wall of the vessel, which is always more contaminated than the bulk because of wall effects. Always sample through the top manway with a vertical probe, or through the bottom manway if accessible.
Mistake 2 - Single-position sampling per layer. A single core at the centre of each layer will miss radial maldistribution. For beds above 4 m diameter, take 3 cores per layer (centre, half-radius, near-wall) and analyse them separately. A failing distributor can create a 5x radial carbon gradient even when the vertical profile looks normal.
Mistake 3 - Sampling hot sieve. Sampling the bed while it is still above 40 C will bias the moisture reading low because of continued desorption during sample handling. Wait for the bed to cool below 40 C. If turnaround schedule does not allow, sample through a heated probe and analyse moisture within 30 minutes of collection.
Mistake 4 - Composite without per-layer. Combining the 5 layers into a single composite sample before analysis destroys the diagnostic value of the protocol. Always analyse each layer separately, even if it doubles the lab cost. The layer-by-layer results are the diagnostic; the composite is a meaningless average.
Mistake 5 - No analytical method citation. A number without a method is not a number. Every analytical result in the report must cite the test method (ASTM, UOP, ISO) and the lab accreditation. This is the difference between a report that survives an insurance claim and one that gets thrown out. The minimum citation is 'method + lab + date' for every data point.
Economic Decision: Re-bed vs Reclaim vs Top-Zone Change-Out
Once the diagnosis is in hand, the economic decision is the next step. Three options are available: full re-bed with fresh sieve, top-zone change-out with fresh sieve (middle and bottom layers retained), or no change (continue running until spec failure). The decision is driven by the contamination gradient, the surface area remaining, and the cost of fresh sieve.
Top-zone change-out is economic when the contamination is localised to the top 200-400 mm (failure modes 1, sometimes 4) and the middle and bottom layers are at fresh-sieve surface area (> 95 percent of original). The cost saving is 60-80 percent of the full re-bed cost, but it requires segregation of the contaminated top material, sieving to remove fines, and validation of the retained material with the full analytical panel before reloading.
Full re-bed is required when the contamination is distributed throughout the bed (failure modes 2, 3, 5, most of 4). The cost is the full sieve quantity plus loading and commissioning. On a 14-tonne bed, the sieve cost alone is 25,000-40,000 USD; on a 50-tonne bed it is 100,000-150,000 USD. Loading and commissioning adds 15-25 percent.
No change is appropriate when the bed is still meeting spec and the layer profile shows > 2 years of life remaining. A common mistake is to change the bed during a turnaround just because it is convenient; the cost of the sieve is wasted and the bed is replaced before end-of-life. Use the layer profile to set a target re-bed date and stick to it.
Pre-Turnaround Checklist for the Sectioning Protocol
Use this checklist the day before the turnaround to confirm the sectioning is executable in the available window. Any unchecked item is a flag to escalate to the turnaround planner.
- Vessel on turnaround scope with operations and planning sign-off
- Inlet and outlet block valves isolatable, vent line clear, N2 purge supply confirmed
- Top manway accessible without scaffolding, or working platform scheduled
- Bottom manway accessible for bottom-layer samples, or 1.5 m thief probe available
- 4-gas monitor calibrated and available for O2/LEL/CO/H2S
- 5 sample containers (500 mL minimum) with airtight lids, pre-labelled
- Stainless steel thief probe, 25-50 mm diameter, 1.5 m length, clean
- Sample labels pre-printed with vessel ID, layer, date, operator
- Duplicate sample containers for chain-of-custody hold if litigation possible
- Lab notified, analytical panel confirmed, instrument time scheduled (5-7 days)
- Confined space entry permit and rescue plan in place if manway diameter < 600 mm
If any item cannot be checked, defer the sectioning to a future turnaround rather than running the protocol with gaps. A partial sectioning (e.g., 3 layers instead of 5) is still useful but the diagnostic confidence is lower.
Next Steps and Procurement Specifications
If your bed is failing prematurely, the first action is to schedule a sectioning during the next turnaround and run the 5-layer protocol. The data will tell you whether the failure is upstream carryover, regeneration breakdown, or normal end-of-life. The data also generates the procurement specification for the next sieve lot: a properly drafted CoA clause that requires the supplier to report BET, LOI, total carbon, total sulphur, and attrition on a per-layer basis (or as a composite with the layer-mix disclosed) will catch most quality problems before the sieve ships.
For procurement teams, the recommended CoA clause for Type 13X, 4A, 5A, and 3A molecular sieve shipments is: 'Report BET surface area (ASTM D3663), loss-on-ignition at 1000 C (ASTM D7341), total carbon (LECO), total sulphur (LECO), attrition (ASTM D4058), and bulk density on a representative sample taken after 24 hours of drum rotation. Report moisture on a separate sample sealed at packaging. Reference values: BET > 700 m2/g, LOI < 1.5 wt percent, carbon < 0.2 wt percent, sulphur < 0.05 wt percent, attrition < 0.05 wt percent. Any deviation > 20 percent from reference is a flag for joint investigation.'
For operations teams, the recommended preventive action is to add online monitoring of the inlet gas for iron (inductively coupled plasma online analyser or X-ray fluorescence on a slipstream) and for chloride (ion chromatography on a slipstream). The data is auditable in real time, and a sustained excursion above 50 ppbv iron or 100 ppbv HCl is a flag to schedule a bed sectioning before the bed fails. Cross-references for the related moisture and sizing methodologies appear in our Karl Fischer vs coulometric vs gravimetric moisture method comparison and our ISO 13320 vs ASTM D4464 PSD method comparison. The carbon-profile interpretation logic for regeneration breakthrough is detailed in our 7 root causes of lengthening regeneration cycles, and the bed-life prediction methodology is grounded in our CoA reading guide for industrial sorbents.
For turnaround planners, the recommended action is to add a 4-hour sectioning window to every molecular sieve bed turnaround, regardless of whether the bed is failing. The data is cheap, fast, and produces a baseline for the next turnaround comparison. A bed that is profiled every 3 years has a documented aging trajectory and a defensible end-of-life date; a bed that is profiled only when it fails leaves money on the table and risks premature replacement.
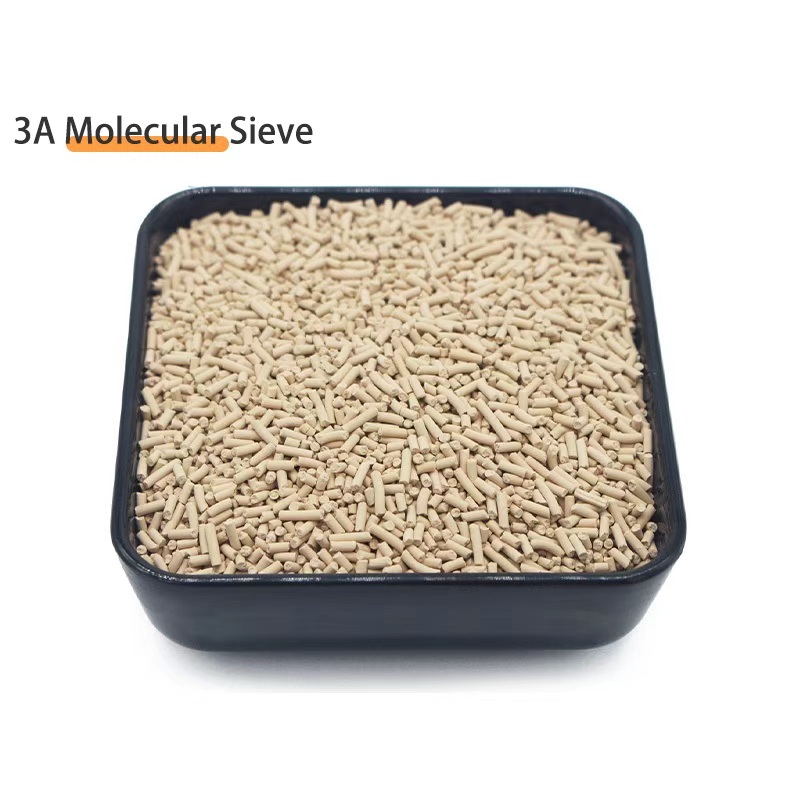
Molecular Sieve 3A / 4A / 5A / 13X (Type A and X)
Bulk molecular sieve beads and pellets with documented BET 700-800 m2/g, attrition under 0.05 wt percent, total carbon under 0.2 wt percent, and pre-shipment CoA per ISO 9001.
View Product Details →