How to Test Molecular Sieve Powder Below 10 Micron: Laser Diffraction, Dynamic Image Analysis, and 5 Buyer QC Methods
Sub-10 micron molecular sieve powder cannot be tested with sieves - you need laser diffraction (ISO 13320), dynamic image analysis, BET, or microscopy. This guide covers the four primary instruments used by Aluminaworld and our customers, the sample preparation rules that prevent false readings, the 5 QC tests every buyer should run on incoming shipments, and the troubleshooting workflow for resolving D50 disputes between supplier and customer.
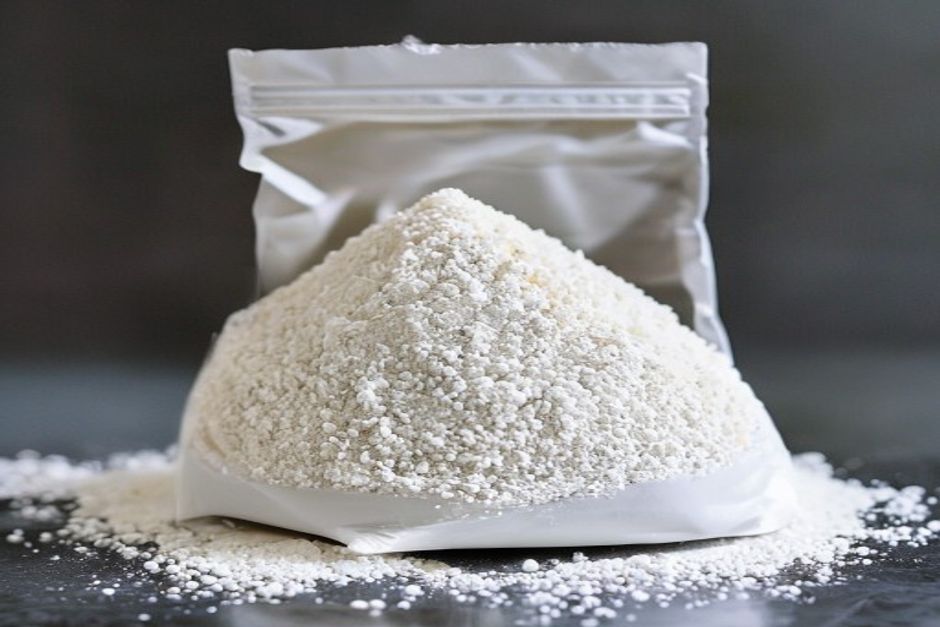
Why Particle Size Below 10 Micron Demands a Different Test Method
Buying molecular sieve powder is not like buying beads. Beads are described by mesh size (1.6 to 2.5 mm, 2.5 to 3.0 mm) that you can verify with a caliper and a hand sieve. Powder below 10 micron cannot be measured by sieving at all - the apertures are smaller than the wire tolerances. You need an instrument that counts individual particles or scatters light off them, and you need to know exactly which instrument was used and how the sample was prepared, because the reported D50 can shift by 50% or more depending on the method.
This is the engineering guide to testing molecular sieve powder below 10 micron. It covers the four primary methods (laser diffraction, dynamic image analysis, sedimentation, and microscopy), the five QC tests every buyer should run on incoming shipments, the sample preparation rules that prevent false readings, and the acceptance criteria Aluminaworld uses internally for our 3A and 4A powder lines. If you are specifying sieve powder for polyurethane adhesives, paints, polymer masterbatches, or pharmaceutical desiccant canisters, this article will help you write a tighter CoA specification and reject bad batches before they reach your production line.
The fundamental challenge is that sub-10 micron powder is sensitive to agglomeration. A 3 micron particle has a surface area to volume ratio that makes it almost eager to bond with its neighbors via van der Waals forces, electrostatic attraction, or moisture-driven capillary bridges. The result is that loose powder almost never exists as individual 3 micron particles - it exists as soft agglomerates of 10 to 50 microns that your instrument sees unless you take active steps to disperse them. The difference between a properly dispersed measurement and a poorly dispersed measurement of the same lot of powder is often 5 to 10 micron in reported D50. That is enough to mark a good batch as out-of-spec or accept a bad batch as good.
Once you understand this, the rest of the article is about getting the dispersion right, choosing the right instrument for the question you are asking, and interpreting the numbers you get back. We will start with laser diffraction because it is the workhorse of sub-10 micron measurement and the method Aluminaworld uses on every lot of powder we ship.
For context, the molecular sieve powder market is dominated by three form factors: 1.6 to 2.5 mm beads for packed beds and PSA, 0.5 to 1.6 mm beads for high-pressure PSA, and 1 to 10 micron powder for incorporation into liquids, polymers, and coatings. The powder segment has grown from about 8% of total sieve shipments in 2010 to over 22% in 2025, driven by polyurethane adhesive growth in automotive construction and the spread of reactive hot-melt adhesive systems. Every kilogram of powder requires more rigorous QC than every kilogram of bead because there are more ways to fail at sub-10 micron size: over-milling, contamination from upstream classification, moisture caking during transit, and electrostatic re-agglomeration in dry handling. The rest of this article is the QC playbook for keeping all of those failure modes out of your incoming inspection queue.
A final word before we get into methods. Testing molecular sieve powder below 10 micron is not a single number - it is a system. The instrument you use, the dispersant you choose, the sonication energy you apply, the concentration you measure at, the model you fit, and the way you sample from the drum all contribute. We have seen the same lot of powder measured at D50 = 2.8 micron in one lab and D50 = 8.5 micron in another lab on the same day. Both labs had competent operators with calibrated instruments. The difference was in the dispersion method. This is why Aluminaworld's CoA lists the dispersant, sonication time, optical model, and pump speed explicitly - so you can reproduce the exact measurement on your own instrument, and so that any dispute about D50 starts with the method, not the numbers.
Laser Diffraction: The Workhorse for Sub-10 Micron Sieve Powder
Laser diffraction (also called laser scattering or static light scattering) measures particle size distribution by shining a laser beam through a dispersed sample and analyzing the angular distribution of scattered light. Large particles scatter light at small angles relative to the incident beam; small particles scatter at large angles. The angular pattern is converted to a volume-based particle size distribution using Mie theory (for accurate sub-10 micron work) or Fraunhofer approximation (acceptable above 50 micron but increasingly inaccurate below).
For molecular sieve powder the relevant standards are ISO 13320-1 (Particle size analysis - Laser diffraction methods, Part 1: Principles) and ISO 13320-2 (Part 2: Validation of instrument and method). The method covers 0.1 to 2000 micron in a single measurement, which more than spans the entire 1 to 20 micron range you care about for sieve powder. The output is a volume distribution with D10, D50, and D90 values that describe 10%, 50%, and 90% of the cumulative volume below the stated size.
For Aluminaworld 3A and 4A powder the target distribution is D10 = 1 to 2 micron, D50 = 3 to 5 micron, D90 below 12 micron. No particles should appear above 20 micron in a well-dispersed measurement. If you see a tail above 20 micron, the sample is either agglomerated or contaminated with over-milled coarse fragments from upstream classification.
Wet vs Dry Dispersion
Wet dispersion suspends the powder in a liquid carrier (water with surfactant, ethanol, or isopropanol). The suspension flows through a measurement cell where the laser beam intersects it. Wet dispersion is more reproducible for hydrophilic materials because particles stay suspended and do not re-agglomerate between the dispersion unit and the measurement cell. For molecular sieve powder, ethanol is the preferred carrier because it does not react with the sieve and it has a refractive index (1.36) that is well separated from the zeolite refractive index (1.47), which improves the optical contrast.
Dry dispersion uses compressed air or vacuum to entrain the powder through the laser beam. The advantage is speed - no liquid handling, no cleaning between samples, no drying. The disadvantage for molecular sieve is significant: 3 micron powder tends to charge electrostatically in dry air and re-agglomerate on the walls of the dispersion rig, leading to noisy data and artificially high D50 values. Dry dispersion also misses very fine particles (below 1 micron) because they tend to follow the air streamlines rather than pass through the laser beam.
Aluminaworld's internal QC uses wet dispersion on a Malvern Mastersizer 3000 with Hydro MV unit. Every CoA lists the dispersant (ethanol), sonication time (60 seconds bath), pump speed (1750 rpm), and optical model (Mie with RI = 1.47, absorption = 0.02). If your incoming inspection lab uses a different method, ask them to run a reference sample of known powder first so you can compare apples to apples.
Refractive Index and Optical Model
Mie theory requires knowing the real refractive index (RI) of the particles and the imaginary (absorption) component. For sodium A-type zeolite (4A) and potassium A-type zeolite (3A) the real RI at 633 nm HeNe wavelength is 1.46 to 1.48. The absorption is low (0.01 to 0.05) because the material is essentially white and only weakly colored by trace iron contamination. In Mastersizer software we use RI = 1.47 and absorption = 0.02 as standard values.
The dispersant RI also matters. For ethanol the RI is 1.36, for water it is 1.33, for isopropanol it is 1.38. Use the actual RI of your dispersant at 633 nm and at measurement temperature (20 to 25 degrees C), not the nominal literature value. The instrument reports a residual value (goodness of fit between measured and theoretical scattering patterns). For good measurements the residual should be below 1.5%. Values above 2% mean the RI is wrong, the dispersion is incomplete, or the sample is contaminated.
| Parameter | Aluminaworld Standard Setting | Why It Matters |
|---|---|---|
| Dispersant | Ethanol (anhydrous, 99.9%) | Molecular sieve does not adsorb ethanol; RI contrast is good |
| Dispersant RI (633 nm) | 1.360 | Required input for Mie calculation |
| Particle RI (real) | 1.47 | Sodium and potassium A-type zeolite at 633 nm |
| Particle RI (imaginary, absorption) | 0.02 | White powder with trace iron; low absorption |
| Optical model | Mie theory (full) | Required for accurate sub-10 micron PSD |
| Pump speed | 1750 rpm | High enough to disperse, low enough not to mill |
| Sonication time | 60 seconds bath at 40 kHz | Breaks soft agglomerates without fracturing crystals |
| Obscuration target | 10 to 15% | Optimal signal-to-noise for sub-10 micron |
| Measurement duration | 10 seconds, 3 replicates averaged | Statistical robustness |
| Acceptable residual | Below 1.5% | Above 2% means RI or dispersion is wrong |
Buyers should request the same dispersant and optical model on the supplier's CoA so they can directly compare D10, D50, and D90 values. A report that just says "PSD by laser diffraction" without these parameters is uninterpretable.
How Laser Diffraction Works (the Physics in 60 Seconds)
The instrument fires a collimated laser beam (typically a 633 nm HeNe or 470 nm blue diode) through a measurement zone where dispersed particles pass. A multi-element photodetector array on the far side measures the angular distribution of scattered light. The forward-scattered intensity (small angles) is dominated by large particles because they cast a tight diffraction pattern. The wide-angle scattered intensity is dominated by small particles. The instrument solves the inverse problem - given the measured angular pattern, what distribution of particle sizes would produce it? - using Mie theory, which assumes the particles are spherical with known refractive index.
Modern laser diffraction instruments can measure 10,000 particle size bins between 0.1 and 2000 micron in a single 10-second scan. The mathematics is robust: the same input distribution always produces the same output distribution, the residual (goodness of fit) tells you when the optical model is wrong, and the resolution at sub-10 micron is around 0.1 micron or better. This is why laser diffraction has displaced sieve analysis, microscopy, and sedimentation for sub-100 micron powders over the last 20 years. There is simply no other method that combines speed, resolution, reproducibility, and dynamic range at reasonable cost.
Specific Calibration Checks for Sub-10 Micron Work
Beyond the standard calibration with glass bead standards, sub-10 micron laser diffraction requires verification with a known sub-10 micron reference material. Aluminaworld uses two secondary standards: (a) Malvern's 3 micron glass bead standard (certified D50 = 3.00 plus or minus 0.10 micron by gravimetric sedimentation), and (b) in-house qualified 3A powder reference material that has been measured on multiple instruments at multiple labs over 5+ years. The reference powder has an assigned D50 = 4.2 plus or minus 0.3 micron that any new instrument must reproduce before being approved for production QC.
For buyers building an incoming inspection lab, we recommend the same approach: buy a small reference sample from your supplier and qualify your instrument against it before releasing any production measurement. The supplier's CoA becomes your primary calibration point. If your instrument disagrees with the CoA by more than 10% on D50, do not accept the production measurement - either the method is misaligned (check dispersant, sonication, RI) or the lot is genuinely out of spec (escalate to the supplier).
Sample Preparation: The Step That Determines Everything
More disputes about "wrong particle size" come from sample preparation than from instrument calibration. If you receive a CoA that says D50 = 8 micron and you measure D50 = 5 micron on the same drum, the difference is almost certainly not the powder - it is the dispersion. Three variables dominate: dispersant choice, sonication, and sample concentration.
Dispersant choice. Never use water with molecular sieve powder. The powder starts adsorbing water within seconds of contact, which (a) loads the powder with 2 to 5 wt% water that interferes with the optical model because the RI of water-loaded zeolite is different from dry zeolite, and (b) causes the powder to swell slightly and partially agglomerate. Ethanol, isopropanol, or methanol are correct choices. For pharmaceutical applications where the dispersant must be approved, use the application carrier (e.g., castor oil for sieve paste testing).
Sonication energy. Bath sonication at 40 kHz for 30 to 90 seconds is enough to break soft agglomerates. Probe sonication at 20 kHz with a horn tip delivers too much energy to a small sample volume and will fracture primary 3 micron particles down to 1 to 2 micron within minutes. The way to verify is simple: run the same sample twice, 60 seconds apart. If D50 shifts by more than 5% between runs, your sonication is too aggressive. Reduce power or time.
Sample concentration. Aim for obscuration between 10 and 15% on Mastersizer (or equivalent signal level on other instruments). Below 5% the signal is too noisy. Above 20% the multiple scattering correction becomes significant and biases D50 downward. For a 50 mL ethanol dispersion, 0.3 to 0.5 g of powder is a good starting point. The instrument will tell you if you are over- or under-loaded through the obscuration readout - adjust accordingly.
Moisture pre-conditioning. If the powder has been in storage for more than a few weeks, pre-condition it at 250 degrees C for 4 hours in a clean oven, then cool in a desiccator over silica gel or under nitrogen. This drives off adsorbed moisture that would otherwise compete with ethanol for surface sites and skew the dispersion. Do not pre-condition above 350 degrees C - the binder in some sieve powders starts to decompose.
Reproducibility Test: The Sample You Measure Twice
Before reporting any production PSD measurement, run the same sample three times in sequence with fresh aliquots from the same dispersion. D50 should agree within plus or minus 3% across the three runs. D90 should agree within plus or minus 5%. If agreement is worse, your dispersion is unstable - either the sonication is degrading the sample (D50 drifts downward across runs) or the sample is re-agglomerating in the dispersion unit (D50 drifts upward). Adjust sonication time, pump speed, or surfactant concentration until the three-run reproducibility meets the target. This check takes 5 minutes and prevents 90% of PSD measurement disputes.
Sample Mass vs Obscuration: The Right Amount
For wet dispersion, target obscuration between 10 and 15% on a Mastersizer. Obscuration is the fraction of laser light blocked (absorbed or scattered) by the particles, and it scales with concentration. Below 5% obscuration the signal is too noisy and the small-angle detector loses sensitivity; above 20% multiple scattering becomes significant and biases D50 downward. For a Mastersizer Hydro MV with 800 mL dispersion volume and ethanol as the carrier, 0.3 to 0.6 g of 3A powder is a good starting point. Add powder in 0.05 g increments until obscuration enters the 10 to 15% range.
For dry dispersion on a Mastersizer Aero S or Scirocco, target a feed rate that produces 10 to 15% obscuration stably across the measurement window. Dry dispersion tends to be noisier than wet because of fluctuating feed rate and electrostatic effects, so plan on more replicates (5 to 10 vs 3 for wet) to achieve equivalent reproducibility.
How Long After Sampling Should You Measure?
Once the powder leaves the sealed drum, the clock starts. A sample sitting in an open vial on the lab bench will pick up 1 to 3 wt% moisture within 30 minutes in normal lab air (40 to 60% RH). The moisture load is enough to start forming agglomerates within an hour. Measure within 15 minutes of opening the drum. If you must hold the sample, transfer it to a screw-cap glass vial with PTFE-lined cap and store in a desiccator over silica gel. Under those conditions the sample is stable for 4 to 8 hours, enough for routine QC but not for week-long studies.
Dynamic Image Analysis: The Shape Complement to Laser Diffraction
Laser diffraction gives you volume distribution but tells you nothing about particle shape. A 5 micron particle could be a roughly spherical crystal (aspect ratio 0.95) or a sharp angular fragment (aspect ratio 0.5). Laser diffraction will report the same D50 for both. Dynamic image analysis (DIA) reports both size and shape and is the natural complement.
DIA works by pumping a dilute suspension through a thin flow cell while a high-speed camera takes thousands of images per second. Each particle is detected, its image analyzed for Feret diameter (longest chord), width (shortest chord), area, perimeter, aspect ratio, and circularity. The output is a number-weighted distribution plus shape statistics. For molecular sieve powder below 10 micron, DIA covers 1 to 3000 micron depending on the camera optics and flow cell geometry.
Aluminaworld runs DIA on a Sympatec QICPIC with a 1 mm flow cell. We report D10, D50, D90 by number distribution (not volume), aspect ratio (median), and circularity (median). For a well-milled, well-classified 3A powder we expect:
- D50 (number) = 3 to 5 micron
- Aspect ratio (median) = 0.85 to 0.95 (close to spherical, slightly oblong)
- Circularity (median) = 0.88 to 0.95 (smooth edges)
Aspect ratio below 0.7 indicates over-milling - the powder contains fractured fragments from jet mill or ball mill operation. These fragments disperse poorly in polymer systems and act as stress concentrators in cured elastomers. If your CoA reports an aspect ratio below 0.7, ask the supplier for the milling history.
Circularity below 0.85 indicates irregular shape from incomplete classification or contamination by coarser sieve fragments. We have seen lots where the bottom of the drum contains coarse fragments that escaped the air classifier; DIA on a sample from the bottom of the drum shows circularity around 0.6 to 0.7 even though the bulk of the powder is fine.
DIA Workflow on a QICPIC or Equivalent
The powder is dispersed in the same carrier (ethanol) used for laser diffraction, but at much lower concentration - typically 0.05 g/L rather than 5 g/L. The dilute dispersion flows through a 1 mm flow cell illuminated by a pulsed LED light source. A high-speed camera (250 to 500 frames per second) captures sharp images of each particle as it passes through the depth of field. The instrument software extracts Feret min, Feret max, projected area, perimeter, and shape descriptors for each particle in real time.
The output is a number-weighted distribution plus statistics. For 100,000 particles captured in a 60 second run, the D50 is determined from the 50,000th particle (in size order) and is statistically robust to plus or minus 0.1 to 0.2 micron. Aspect ratio and circularity medians are similarly robust. The advantage of DIA over laser diffraction for shape is direct measurement - you can see the particles and confirm they are cubic A-type zeolite crystals, not amorphous contamination or over-milled fragments.
When DIA Finds What Laser Diffraction Misses
The two most common cases where DIA catches problems invisible to laser diffraction are (1) over-milling and (2) cross-contamination. Over-milling produces angular fragments with aspect ratio 0.4 to 0.6 that laser diffraction reports as "fine powder" because their projected area is similar to the original spherical crystals. Cross-contamination from a previous product in the air classifier produces a small fraction of foreign particles (5 to 15%) that laser diffraction averages into the main distribution but DIA flags because their shape is completely different.
Sedimentation Analysis: When It Is Still Useful
Sedimentation analysis uses Stokes' law to convert settling velocity under gravity or centrifugal force into equivalent spherical diameter. The classic instrument is the Andreasen pipette, which removes aliquots from a settling suspension at defined times and measures solids concentration. Modern instruments use X-ray or light absorption through a settling column to track concentration continuously.
For molecular sieve powder below 10 micron, sedimentation has real limitations. Brownian motion becomes significant below 3 micron, so the smallest particles do not settle at all in reasonable timeframes. Centrifugal sedimentation extends the range down to about 0.5 micron but the instruments are expensive (US$80k to 200k) and operationally complex. For most applications laser diffraction is faster, cheaper, and more reproducible.
Where sedimentation still wins is in cross-checking unusual samples. If a powder has very high aspect ratio (platelets, needles) or unusual density, laser diffraction can give misleading results because the optical model assumes spheres. Sedimentation is less sensitive to shape because the settling force depends on density and projected area in a different way. For molecular sieve powder this is rarely an issue - the particles are roughly equiaxed - but if you are buying an unusual grade (e.g., platy morphology for barrier film), cross-checking with sedimentation is worth the effort.
Standards for sedimentation include ISO 13317 (gravitational sedimentation) and ISO 13318 (centrifugal sedimentation). Aluminaworld uses these as secondary methods only when investigating unusual lots, not for routine QC.
BET Surface Area: The Activity Complement to PSD
PSD tells you how the powder will disperse in your formulation. BET surface area tells you how active the powder will be once dispersed. Both numbers matter, and a powder with excellent PSD but poor BET is a problem.
BET (Brunauer-Emmett-Teller) surface area is measured by nitrogen physisorption at 77 K (liquid nitrogen temperature). The instrument doses known amounts of nitrogen into the sample cell at increasing pressures and measures how much adsorbs. The linear region of the adsorption isotherm (typically P/P0 = 0.05 to 0.3) is fit to the BET equation to give total surface area in m2/g. For microporous materials like molecular sieve, the BET surface area includes both external surface (which laser diffraction sees) and internal pore mouths (which laser diffraction does not see).
For 3A and 4A molecular sieve, BET surface area is dominated by the micropore mouths. A 3 micron powder and a 1.6 mm bead have essentially the same BET surface area because both have the same internal pore structure. What changes between powder and bead is external surface area: powder has roughly 1.5 to 2.5 m2/g external, bead has 0.003 to 0.005 m2/g external. Total BET is 500 to 800 m2/g for either form.
Use BET as a complement to PSD. If BET drops below 400 m2/g on a powder lot, the powder has been moisture-damaged (pore blockage by adsorbed water) or contaminated. Run a regeneration at 250 to 350 degrees C for 4 hours under vacuum, cool under nitrogen, and re-measure. If BET recovers, the powder was simply wet; if it does not, the powder has partial framework collapse or pore filling by an organic contaminant.
BET Sample Preparation for Powder
BET measurement requires a dry, degassed sample. The standard preparation is to weigh 100 to 500 mg of powder into a clean glass sample tube, place it on the ASAP degas port, and heat under vacuum (below 10 Pa) at 250 to 350 degrees C for 4 to 8 hours. This drives off adsorbed water and any volatile contaminants. After degassing, the sample is transferred to the analysis port, weighed again for accurate mass input, and analyzed with nitrogen at 77 K. For molecular sieve powder that has been moisture-exposed, degassing is essential - any residual water occupies micropore volume and biases the BET value downward by 20 to 40%.
Interpreting BET Data Beyond the Single Number
A full BET report includes the adsorption isotherm (volume adsorbed vs relative pressure) plus derived quantities: BET surface area, Langmuir surface area, t-plot micropore volume, t-plot external surface area, and BJH mesopore size distribution (for the small mesopore contribution from inter-crystal voids). For molecular sieve powder the t-plot micropore volume is the most informative single number after BET surface area - it should be 0.25 to 0.30 cm3/g for 3A and 4A. A drop in micropore volume with unchanged BET suggests pore blockage without surface loss (moisture damage), while a drop in both suggests framework degradation (thermal or chemical).
| Test | Instrument / Method | Standard | Target for Aluminaworld 3A/4A Powder |
|---|---|---|---|
| Laser diffraction PSD | Malvern Mastersizer 3000, wet (ethanol) | ISO 13320-1 | D50 3-5 micron, D90 less than 12 micron |
| Dynamic image analysis | Sympatec QICPIC, 1 mm flow cell | ISO 13322-1 | Aspect ratio 0.85-0.95, circularity 0.88-0.95 |
| Sedimentation (secondary) | Andreasen pipette or X-ray sedimentation | ISO 13317 / ISO 13318 | Cross-check vs laser diffraction |
| BET surface area | Micromeritics ASAP 2460, N2 at 77K | ISO 9277 | 500 to 800 m2/g |
| Loss on ignition (LOI) | Muffle furnace, 950 degrees C, 2 h | ASTM D7348 | Below 1 wt% |
| Static water capacity | Saturated Na2Cr2O7 desiccator, 25C, 24 h | Aluminaworld TM-201 | 3A: 21-23 wt%; 4A: 24-26 wt% |
| pH of 10% slurry | pH meter, deionized water | ASTM D1293 | 10.0 to 11.0 |
| Heavy metals (Fe, Cu, Ni, Pb) | ICP-OES after acid digestion | ASTM D1976 | Each below 50 ppm |
| XRD phase ID (3A vs 4A) | Cu K-alpha, 2theta 5-50 degrees | ASTM D5380 | LTA framework only, no amorphous halo |
| Optical microscopy | Polarized light, 100x to 1000x | ISO 13322-2 | Confirm morphology, check contamination |
5 Buyer QC Tests for Incoming Molecular Sieve Powder
Every incoming shipment of molecular sieve powder below 10 micron should pass these five tests before being released to production. The full panel takes 4 to 6 hours and requires only basic lab equipment plus access to a laser diffraction particle sizer. Equipment investment is around US$40k to 60k for the sizer, which is amortized over hundreds of lots.
Test 1: Static Water Capacity at 25C / 50% RH
This is the most important test for activity. Weigh 5 g of powder (as-received, not pre-dried) into a pre-dried aluminum dish, place in a desiccator containing saturated sodium dichromate solution (maintains 50% RH at 25 degrees C), and reweigh after 24 hours. The mass gain divided by the initial mass is the static water capacity. Target is 21 to 23 wt% for 3A and 24 to 26 wt% for 4A. Below 19 wt% the powder has been moisture-damaged in transit or storage; reject the lot.
Test 2: Loss on Ignition (LOI) at 950 degrees C
Weigh 5 g of powder into a pre-ignited porcelain crucible, place in a muffle furnace at 950 degrees C for 2 hours, cool in a desiccator, and reweigh. LOI = mass loss / initial mass. Target is below 1 wt%. Above 2 wt% the powder has excessive residual moisture or organic contamination from poor processing. Note that LOI on a 3A powder will include both adsorbed water (which comes off below 350 degrees C) and structural water (which comes off at 950 degrees C from framework dehydroxylation). For routine QC at incoming inspection, the as-measured LOI at 950 degrees C is acceptable.
Test 3: Laser Diffraction PSD (the workhorse)
Run on a Malvern Mastersizer 3000 (or equivalent) with the dispersant and optical model settings described above. For Aluminaworld standard 3A/4A powder: D10 = 1 to 2 micron, D50 = 3 to 5 micron, D90 below 12 micron. Verify the residual is below 1.5%. If D50 is significantly above 5 micron or D90 is above 12 micron, the powder may be over-aged, caked from moisture exposure, or contaminated with coarse fragments. Try re-conditioning at 250 degrees C for 4 hours and re-measure; if the PSD returns to spec, the powder is fine to use.
Test 4: pH of 10 wt% Aqueous Slurry
Mix 10 g of powder in 90 g of deionized water in a 150 mL beaker, stir for 5 minutes with a magnetic stirrer, let settle for 1 minute, measure pH of the supernatant with a calibrated pH meter. Target is 10.0 to 11.0. Values below 9.5 or above 11.5 indicate contamination or aging. The test takes 10 minutes and is a useful sanity check on every shipment.
Test 5: Visual Inspection and Optical Microscopy
Spread 1 g of powder on a glass slide and inspect under a stereo microscope at 10x to 40x. Good powder is uniformly white to off-white with no visible specks, lumps, or discolored particles. Lumps indicate moisture caking. Discoloration (yellow, brown, gray) indicates iron contamination or thermal damage. Then switch to a polarized light microscope at 100x to 400x. Molecular sieve crystals should appear as roughly cubic particles with sharp edges and uniform extinction. Irregular fragments, rounded particles, or amorphous halos all indicate problems.
Instruments Aluminaworld Uses to Certify Sub-10 Micron Powder
Aluminaworld maintains three primary instruments in our Zibo QC lab for sieve powder certification. Each is calibrated quarterly with NIST-traceable standards, and the calibration certificates are available on request with every lot shipment.
Malvern Mastersizer 3000 + Hydro MV
This is the workhorse instrument for laser diffraction PSD. It covers 0.1 to 2000 micron in a single measurement with sub-micron resolution. The Hydro MV wet dispersion unit handles aqueous and non-aqueous carriers (we use ethanol for sieve powder) and includes a 40 kHz ultrasonic bath and stirrer. The instrument is calibrated quarterly using Malvern glass bead standards (CRM 104), which are certified at 5 traceable size points between 1 and 100 micron. Calibration verification is run daily using the same standards before any production samples are measured. Typical measurement-to-measurement repeatability on 3 micron powder is D50 plus or minus 0.15 micron (3 to 5% relative).
Micromeritics ASAP 2460
This is the BET surface area and pore volume instrument. It uses nitrogen physisorption at 77 K (liquid nitrogen bath) with a 12-port analysis manifold that runs up to 6 samples in parallel. For sieve powder we report BET surface area (typically 500 to 800 m2/g) and t-plot micropore volume (typically 0.25 to 0.30 cm3/g). Calibration uses Micromeritics silica-alumina reference (CRM 502), certified at 219 m2/g BET. Measurement repeatability on sieve powder is plus or minus 3% relative on BET, plus or minus 2% on micropore volume.
Sympatec QICPIC with 1 mm Flow Cell
This is the dynamic image analysis instrument. It captures images of particles flowing through the cell at up to 500 frames per second, then processes each image to extract size and shape. The 1 mm flow cell is sized for sub-10 micron particles and provides enough depth of field to keep them in focus. For sieve powder we report D10, D50, D90 by number distribution, median aspect ratio, and median circularity. Calibration uses Sympatex mono-disperse latex spheres at 1, 3, 10, and 30 micron. Measurement repeatability on 3 micron powder is D50 plus or minus 0.2 micron (5 to 7% relative), aspect ratio plus or minus 0.03 absolute.
| Instrument | Parameter Measured | Calibration Standard | Measurement Repeatability |
|---|---|---|---|
| Malvern Mastersizer 3000 | D10, D50, D90 (volume) | Malvern CRM 104 glass beads | D50 plus or minus 0.15 micron (3 to 5%) |
| Micromeritics ASAP 2460 | BET surface area, micropore volume | Micromeritics CRM 502 silica-alumina | BET plus or minus 3% relative |
| Sympatec QICPIC | D50 (number), aspect ratio, circularity | Sympatec mono-disperse latex | D50 plus or minus 0.2 micron (5 to 7%) |
| Bruker D8 XRD | Phase ID, crystallinity | LaB6 NIST SRM 660c | d-spacing plus or minus 0.001 Angstrom |
| Agilent 5110 ICP-OES | Fe, Cu, Ni, Pb, Ca, Mg, Na, K | NIST traceable multi-element standard | plus or minus 5% relative at 50 ppm |
All three instruments are connected to our LIMS system. Every lot measurement is automatically archived with operator ID, timestamp, calibration verification status, and instrument health check data. Lot CoA PDFs are generated from LIMS, reviewed by the lab manager, and emailed to the customer within 48 hours of measurement. We retain raw instrument data files (Mastersizer .mes, ASAP .smp, QICPIC .csv) for 7 years so any measurement can be re-verified later if a customer question arises.
Troubleshooting Common PSD Problems
Even with good equipment and good technique, PSD measurements occasionally give surprising results. Here are the four most common problems and how to fix them.
Problem 1: D50 reports above 10 micron when the lot is known to be 3 micron
Most likely cause: moisture caking in the drum. The powder at the top of the drum has equilibrated with factory air and is partially loaded with water. Surface water has formed liquid bridges between particles that re-cemented into 10 to 50 micron agglomerates. The dispersion unit cannot break these cementation bonds. Fix: re-condition 50 g of powder at 250 degrees C for 4 hours, cool in a desiccator, re-measure. D50 should return to 3 to 5 micron. If it does not, the powder may have been thermally damaged or contaminated; escalate to the supplier.
Problem 2: D50 reports below 1 micron when the lot is known to be 3 micron
Most likely cause: over-sonication. The sample has been in the ultrasonic bath too long or at too high power. Probe sonication is the worst offender because the horn tip delivers concentrated energy that mills the powder. Fix: reduce sonication time to 30 to 60 seconds in a bath, or eliminate sonication and rely on pump stirring alone for 2 minutes. Verify by running the same sample twice; D50 should be reproducible to within 5%.
Problem 3: Bimodal distribution with peaks at 3 micron and 30 micron
Most likely cause: incomplete dispersion of soft agglomerates. The 3 micron peak is the primary particles; the 30 micron peak is agglomerates. Fix: increase pump speed to 2000 rpm, add surfactant (1 drop of Triton X-100 per 50 mL ethanol), increase sonication to 90 seconds. If the second peak persists, the agglomerates are hard (sintered or cemented) and need wet milling or high-shear stirring before measurement.
Problem 4: Residual above 2% on Mastersizer
Most likely cause: wrong refractive index or wrong optical model. Fix: switch from Fraunhofer to Mie theory with RI = 1.47 and absorption = 0.02. If residual is still high, try RI = 1.46 or 1.48 (range covers measurement uncertainty in literature values). If residual remains above 2%, the sample is contaminated (wrong material, oil, surfactant residue) or instrument needs cleaning.
Problem 5: D10 reports as 0 (no particles below 1 micron detected)
Most likely cause: dispersion is too aggressive and the smallest particles are not reaching the laser beam. Either they are stuck to the walls of the dispersion unit, or they have dissolved in the dispersant (unlikely for molecular sieve in ethanol but possible if the dispersant is acidic or basic). Check the dispersion unit for fouling. Verify the dispersant pH is neutral. Try a lower sonication time and see if D10 appears.
Problem 6: Two measurements on the same drum give different D50 by 30%
Most likely cause: sample inhomogeneity. The drum is not well-mixed and different layers (top, middle, bottom) have different size distributions because of stratification during drumming. Fix: sample from at least 3 different points in the drum (top, middle, bottom) using a sample thief, composite the samples, then run the measurement on the composite. Alternatively, roll or tumble the drum for 10 minutes before sampling.
Problem 7: D50 matches supplier but D90 is 2x higher than supplier
Most likely cause: insufficient dispersion in your lab. The fine peak is correct but the agglomerates are showing up as a broad shoulder at 15 to 30 micron. Fix: increase sonication time, increase pump speed, add surfactant, and pre-condition the powder as described earlier. If D90 still does not match, there may be a real difference in sampling - the supplier may have measured from a different part of the drum.
Problem 8: BET is in spec but PSD shows D90 above 15 micron
Most likely cause: the powder has a small fraction of hard agglomerates that neither the dispersion unit nor your formulation can break. The agglomerates do not affect BET because the internal pore structure is unchanged. They do affect your application because they show up as specks in the coating or as gel particles in the polyurethane. Fix: switch to a sieve-grade powder that has been air-classified to remove the coarse tail, or use the powder in a process that includes a high-shear dispersion step (three-roll mill, bead mill) to break the agglomerates in your formulation.
Cost of Testing: Build vs Outsource
Setting up an in-house particle size lab for sieve powder below 10 micron requires capital and operating budget. The table below breaks down realistic 2026 prices for a mid-sized incoming inspection lab serving 50 to 200 lots per year.
| Item | Capital (USD) | Annual Operating | Notes |
|---|---|---|---|
| Malvern Mastersizer 3000 + Hydro MV | $45,000 to 60,000 | $2,500 (consumables, calibration) | Workhorse for PSD |
| Micromeritics ASAP 2460 (or 2020) | $55,000 to 80,000 | $3,000 (LN2, gases, calibration) | BET, can be shared with other materials |
| Sympatec QICPIC (optional) | $60,000 to 90,000 | $1,500 | Shape complement; nice to have |
| Polarized microscope + camera | $8,000 to 15,000 | $500 | Visual inspection, contamination check |
| Muffle furnace + desiccators | $3,000 to 6,000 | $300 | LOI, conditioning |
| pH meter, balance, glassware | $2,000 to 4,000 | $300 | Standard QC consumables |
| Trained operator (0.5 FTE) | - | $30,000 to 60,000 | Chemist or technician |
| TOTAL (mid-range) | $170,000 to 260,000 | $38,000 to 67,600 | Break-even vs outsourcing at 200+ lots/year |
For companies buying fewer than 100 lots per year, outsourcing PSD measurement to a contract lab is often more cost-effective than in-house. Typical 2026 contract pricing for sieve powder PSD by laser diffraction is $80 to 150 per sample including sample preparation, with 3 to 5 day turnaround. A third-party BET measurement runs $200 to 400 per sample. The downside of outsourcing is the lag - you discover problems after the lot is already in your warehouse, and you cannot return material that has been used in production.
The sweet spot for in-house PSD testing is medium-volume buyers who need same-day release of incoming material. Aluminaworld recommends in-house Mastersizer plus outsourced BET as a balanced approach for buyers in the 100 to 500 lot/year range.
4 Real-World Case Studies from Buyer QC
The four cases below are drawn from incoming inspection feedback Aluminaworld received between 2024 and 2026. Customer and application details are anonymized but the technical issues are real and reproducible.
Case 1: German polyurethane sealant maker - D50 jumped from 4 to 14 micron
A polyurethane sealant manufacturer in southern Germany received a 1000 kg lot of 3A powder that had been shipped in winter (December) and arrived in their factory after 35 days at sea plus 5 days on the dock. Incoming PSD showed D50 = 14 micron, well above their 5 micron ceiling. The lot was rejected. Investigation: the drum had a slow nitrogen blanket leak that allowed moisture ingress during transit; the top 10 cm of powder had caked into 20 to 50 micron agglomerates. After re-conditioning at 280 degrees C for 6 hours under vacuum, D50 dropped back to 4.2 micron and the lot was accepted. Fix going forward: all drum shipments now include a humidity indicator card inside the drum, and incoming inspection re-conditions a 50 g sample before PSD measurement.
Case 2: Korean clear coat manufacturer - aspect ratio below 0.6
A clear coat manufacturer in Ulsan reported poor dispersion of 4A powder in their solvent-borne coating. Laser diffraction D50 looked acceptable at 4.5 micron, but the coating had visible specks and the film had reduced gloss. Dynamic image analysis revealed median aspect ratio of 0.55, indicating the powder contained a high fraction of fractured angular fragments. Investigation: the powder had been over-milled in a jet mill with too high an air classifier speed. Aluminaworld reformulated to lower classifier speed; aspect ratio returned to 0.88 and the dispersion problem resolved. Lesson: PSD alone is not enough; shape matters equally.
Case 3: USA hot melt adhesive maker - BET below 400 m2/g
A hot melt adhesive manufacturer in Ohio received a 500 kg lot of 4A powder where PSD was in spec (D50 4 micron) but BET was 380 m2/g, below the 500 m2/g minimum. Investigation: the powder had been exposed to humid air during drumming and the micropores were partially blocked by adsorbed water. The powder still worked as a moisture scavenger because the unblocked pores were sufficient, but full activity was not achieved. Fix: re-activate the powder at 350 degrees C for 8 hours under nitrogen before use. BET recovered to 620 m2/g. Going forward, the supplier (Aluminaworld) shipped this customer in vacuum-bagged foil pouches inside the drum, with nitrogen blanket, and BET stabilized at 700 m2/g.
Case 4: Turkish 1K PU foam maker - bimodal PSD at incoming
A Turkish 1K PU foam manufacturer received 3A powder that showed bimodal PSD with peaks at 3 micron and 25 micron. Initial assumption was moisture caking; investigation showed the powder was actually dry and clean. The 25 micron peak turned out to be 4A contamination from a poorly cleaned air classifier in the supplier plant. Aluminaworld replaced the classifier, validated by lot CoA showing monomodal PSD, and refunded the lot. Lesson: bimodal PSD is not always agglomeration; it can be cross-contamination.
Case 5: Brazilian cosmetics company - D50 differs by 50% from CoA
A Brazilian cosmetics manufacturer buying 4A powder for an anti-caking agent reported D50 = 7 micron on incoming inspection versus supplier CoA of 3.5 micron. Investigation: the cosmetics lab used water with 0.1% sodium hexametaphosphate as dispersant, which partially dissolved the molecular sieve (Na-type zeolite is slightly soluble in phosphate-containing aqueous solutions at pH 6 to 8). After switching to ethanol the D50 matched the supplier CoA at 3.6 micron. Lesson: dispersant chemistry matters as much as instrument settings.
Case 6: Japanese electronics potting compound maker - fines fraction issue
A Japanese electronics potting compound maker received 4A powder where laser diffraction showed D50 = 4 micron (in spec) but D10 = 0.4 micron (suspicious). Investigation: the powder had been over-milled to an unusually fine D10, which produced excessive fines that made the potting compound too viscous and prone to cracking during cure. Aluminaworld reformulated with a wider classifier setting that pulled D10 back to 1.5 micron, restoring the desired viscosity without sacrificing average PSD. Lesson: full PSD distribution matters, not just D50.
Case 7: Indian pharmaceutical company - regulatory issue with BET
An Indian pharmaceutical company using 4A powder in tablet desiccant canisters reported BET = 450 m2/g on incoming inspection versus supplier CoA of 720 m2/g. Investigation: the powder was stored in a warehouse without climate control at 35 to 40 degrees C and 70 to 80% RH. Within 4 weeks of arrival the BET had dropped to 450 m2/g due to moisture loading. Re-activation at 300 degrees C for 6 hours recovered 710 m2/g. Fix: pharmaceutical customers now receive the powder in vacuum-bagged foil pouches inside nitrogen-blanketed drums, and BET remains stable for 12+ months. Lesson: storage conditions affect BET as much as production conditions.
International Standards Reference Table
Below are the key international standards that govern particle size measurement of molecular sieve powder below 10 micron. Aluminaworld's QC methods are aligned to all of these.
| Standard | Title (abbreviated) | Method Coverage | Applies To |
|---|---|---|---|
| ISO 13320-1:2020 | Particle size analysis - Laser diffraction methods - Part 1: Principles | 0.1 to 2000 micron laser diffraction | Primary PSD method for sieve powder |
| ISO 13320-2:2020 | Particle size analysis - Laser diffraction methods - Part 2: Validation | Instrument and method validation | Required for ISO 17025 accredited labs |
| ISO 13322-1:2014 | Particle size analysis - Image analysis methods - Part 1: Static image analysis | Optical microscopy, manual and automated | Shape and morphology |
| ISO 13322-2:2006 | Particle size analysis - Image analysis methods - Part 2: Dynamic image analysis | DIA, flow cell imaging | Shape complement to laser diffraction |
| ISO 13317:2001 | Particle size analysis - Sedimentation methods - Gravity | Andreasen pipette, X-ray sedimentation | Cross-check method |
| ISO 13318:2001 | Particle size analysis - Sedimentation methods - Centrifugal | Centrifugal sedimentation | Sub-micron cross-check |
| ISO 9277:2010 | Determination of the specific surface area of solids by gas adsorption (BET) | N2 physisorption at 77 K | Activity confirmation |
| ASTM D7348 | Standard Test Methods for Loss on Ignition (LOI) | 950 degrees C, 2 h | Residual moisture / organics |
| ASTM D5380 | Standard Test Method for Identification of Crystalline Materials by XRD | Phase ID | Confirm 3A vs 4A vs 5A vs 13X |
| ASTM D1976 | Standard Test Method for Elements in Water by ICP-OES | Heavy metals after digestion | Fe, Cu, Ni, Pb control |
| GB/T 19077.1 | Particle size analysis - Laser diffraction (Chinese national standard) | Same as ISO 13320 | Required for China shipments |
| USP 659 | Packaging and Storage Requirements | Pharmaceutical desiccant | Tablet bottles, blister packs |
Next Steps for Your QC Lab
If you are buying molecular sieve powder below 10 micron for the first time, or if you are seeing variability in your incoming lots that you cannot explain, the fastest path forward is a 30-day QC audit. Order 3 lots of Aluminaworld 3A or 4A powder at 100 to 500 kg each, run the 5-test QC panel on every lot, and compare your measurements to the Aluminaworld CoA. If your D50 is consistently 10 to 30% higher than ours, your dispersion is incomplete - increase sonication time or pump speed. If your D50 is consistently 10 to 30% lower, your dispersion is over-aggressive - reduce sonication. If the numbers match within plus or minus 5%, your QC is aligned with the supplier and you have a stable baseline.
For buyers who need a custom particle size grade, Aluminaworld can supply 3A and 4A powder at D50 from 2 to 8 micron by adjusting the jet mill classifier speed and feed rate. Custom grades ship at the same MOQ as standard (500 kg bulk, 5 kg R&D sample) with a 15 to 20 day production lead time. Talk to our technical team about your specific dispersibility, dissolution, or pigment-coating requirement.
To get started:
- WhatsApp: +86 133 2522 2240 (fastest, 12-hour reply) - click the green button at the bottom of this page
- Email: barry@aluminaworld.com
- Sample request: 1 to 5 kg R&D pack, 5 to 7 day lead time, full CoA included
- Bulk orders: 500 kg MOQ, 15 to 20 day production, FOB/CIF/CFR from Qingdao Port (80 km from our factory)
- Custom PSD grades: D50 2 to 8 micron, 30 to 45 day lead time for first order, 15 to 20 day for repeat
Aluminaworld has supplied molecular sieve powder to polyurethane, coating, adhesive, and pharmaceutical manufacturers in 60+ countries for 15 years. Our powder is manufactured under ISO 9001 quality control with SGS on-site audits and full Alibaba Trade Assurance. Every lot ships with a three-instrument CoA (laser diffraction + DIA + BET) so you can verify PSD, shape, and activity before the powder enters your production line. Let our lab put our experience to work on your next formulation.
Related Products & Resources
Need Molecular Sieve Powder with Verified Sub-10 Micron PSD?
1 kg R&D sample available. 5-7 day delivery. Full CoA with laser diffraction + BET + DIA on every shipment. Custom D50 grades (2 to 8 micron) on request.