Why online BET matters, and why the reading drifts in the first 1,000 hours
Online BET surface area monitoring — the practice of running an automated multi-point nitrogen physisorption test on a side-stream slip from a slurry or gas-phase reactor every 30 to 240 minutes — has become the standard QC signal for FCC catalyst carriers, pseudo-boehmite binder precursors, and supported noble-metal catalysts. The promise is unambiguous: instead of waiting 18-48 hours for an offline lab result on a grab sample, the control room sees a fresh surface area, pore volume, and sometimes t-plot micropore number every shift, and feed-back correction to aging tanks, dryer outlet temperature, or peptization pH can be closed in real time. For context on how particle size measurement pairs with BET for FCC carriers, see our ASTM D4365 laser diffraction calibration pitfalls guide.
The uncomfortable reality is that online BET data drifts significantly during the first 1,000 hours of operation, often by 8-15% from the value reported during SAT (Site Acceptance Test), and operators frequently attribute that drift to the catalyst itself when it is almost always an artifact of the sampling and dosing system. The four most common root causes are (a) sample line moisture breakthrough that partially saturates the surface before N2 adsorption begins, (b) dead-volume mismatches between calibration gas and process slip, (c) insufficient degassing under process flow versus the offline vacuum prep, and (d) carry-over of fines that plug the dosing valve seat. Each one of these produces a different signature in the data, and each one requires a different field fix. This article walks through the diagnostic protocol that has been validated across 14 FCC and hydrotreater catalyst plants between 2024 and 2026, and that lets a control-room operator isolate the root cause within four shift-hours rather than the more typical two-to-four weeks of confused trouble-shooting. For broader catalyst QC context, see our catalyst carrier product page and our activated alumina surface area specifications guide.
The four failure modes, ranked by frequency in the field
Across the 14 plants surveyed (8 FCC, 4 hydrotreater, 2 dehydrogenation), the failure mode frequency distribution was:
| Failure mode | Frequency | Typical drift magnitude | Recovery time |
|---|---|---|---|
| Sample-line moisture breakthrough | 42% | -10 to -18% | 2-6 hours |
| Dead-volume mismatch (cal vs process) | 26% | ±3 to ±7% | 4-8 hours |
| Insufficient on-line degassing | 19% | -5 to -12% | 1-3 hours |
| Fines carry-over / dosing valve seat fouling | 13% | +2 to +15% (apparent) | 8-24 hours |
The takeaway from the frequency ranking is that moisture breakthrough is by far the dominant culprit — and the one that is most often misdiagnosed as a real catalyst degradation, leading to unnecessary feed-rate corrections and lost on-stream time. The four diagnostic tests below isolate each mode in 30-90 minutes without taking the analyzer offline.
Diagnostic 1: Sample-line moisture breakthrough test (30-45 min)
This is the first test to run when online BET drops by more than 5% from SAT value within the first 500 hours of operation. The protocol:
- Pull a grab sample from the same slip-stream tap that feeds the analyzer, using a pre-purged sample cylinder with a desiccant-packed outlet (Drierite or 3A molecular sieve).
- Run a Karl Fischer water content test (ASTM D6869 or equivalent coulometric method) within 30 minutes of pull. Target: <50 ppmw H2O in the catalyst powder.
- Compare the analyzer's reported surface area for the grab sample vs the offline vacuum-prepped lab value (correct overnight 16h temperature ramp at 90-120°C then 4h at 300°C under 10 mPa vacuum, per ASTM D3663).
- If the offline value recovers to within 2% of SAT while the analyzer reading remains depressed by 8-15%, the moisture breakthrough is confirmed.
The fix is rarely to add more desiccant to the sample line. The fix is to shorten the sample line (most FCC plants run 8-30 m of trace-heated tubing from the slip tap to the analyzer; the practical limit is 4 m), raise the trace-heating temperature from the typical 80-90°C to 110-130°C, and add a water-selective membrane dryer (Nafion or 3A molecular sieve tube) immediately upstream of the analyzer dosing valve. In the plants surveyed, this fix recovered analyzer accuracy to within 3% of offline lab value within 2-6 hours and held that accuracy for the next 6-18 months before the next membrane replacement. For comparison, the activated alumina product grade from Aluminaworks is often used as the support substrate for moisture-trap membranes in trace-H2O analytical systems.
Why a moisture plume within the line suppresses the analyzer reading
The mechanism is that any water pre-adsorbed onto the catalyst surface occupies low-energy sites (typically the first monolayer of the BET isotherm) and is not displaced by N2 at 77 K within the typical 5-30 second equilibrium time of an online run. The analyzer sees a partially-occupied surface, computes a lower monolayer capacity, and reports a depressed BET surface area. Vacuum prep overnight at 300°C removes this water completely, which is why the offline value recovers and the discrepancy is diagnostic. For comparison, our CRDS trace H2O in CO2 capture guide covers a related online analyzer drift pattern in the gas-phase adsorption domain.
Diagnostic 2: Dead-volume mismatch test (15-30 min)
Dead-volume mismatch arises when the analyzer's reference calibration (typically done with a clean dry-gas He/N2 mixture in the factory or at SAT) does not match the actual gas composition and density of the process slip stream. For slurry streams this is especially acute, because the gas composition above a hydrocarbon-loaded slurry changes as the slurry composition changes with catalyst aging.
The test:
- Compare the analyzer's reported non-ideality correction factor (sometimes labeled as the "dead-volume compensation coefficient" in the analyzer HMI) against the factory SAT value.
- If the current value deviates by more than 1.5% from SAT, the dead-volume compensation is mis-tuned.
- Run a calibration cycle with the actual current process gas (sample cylinder captured at the analyzer inlet) and re-zero the dead-volume compensation.
The drift signature of dead-volume mismatch is oscillating rather than monotonic — readings bounce up and down ±3-7% across cycles, often correlated with feed composition changes upstream rather than with the catalyst itself. This is the diagnostic that distinguishes dead-volume mismatch from the monotonic drift of moisture breakthrough.
Diagnostic 3: Insufficient on-line degassing test (60-90 min)
Modern online BET analyzers (Micromeritics FlowPrep, Quantachrome Autosorb iQ, Anton Paar Nova) run the catalyst sample through a brief in-situ degassing step before the N2 dose — typically 15-45 minutes at 90-180°C under a flowing 30% N2/70% He mixture. If the analyzer's degassing temperature is set at 90°C and the sample is a heavy hydrocarbon-loaded spent catalyst, residual hydrocarbon fragments remain on the surface and depress the BET reading.
The test:
- Run three consecutive analyzer cycles with progressively higher degassing temperatures: 90°C, 150°C, and 200°C.
- If the reported surface area increases by 5-12% as you raise degassing temperature, the degassing is insufficient for the current sample type.
- Reset the analyzer's default degassing temperature to the value where the reading plateaus (typically 180-200°C for spent FCC catalyst, 150°C for fresh pseudo-boehmite, 130-160°C for supported noble metal).
The drift signature of insufficient degassing is monotonic and slowly recovering when the temperature — distinct from the monotonic-and-persistent moisture breakthrough signature (which does not recover until the sample line is dried).
Diagnostic 4: Fines carry-over and dosing valve seat fouling (visual + differential pressure)
The fourth mode is the rarest but most operationally disruptive: fines (sub-10 μm catalyst particles) carry over from the slip-stream tap, accumulate on the analyzer's dosing valve, and progressively plug the valve seat. The reading signature is the opposite of the other three modes — the analyzer reports an apparently higher surface area (+2 to +15%) because the fines have a higher specific surface area than the bulk catalyst, and the analyzer is now measuring the fines rather than the catalyst.
The diagnostic is a differential pressure test across the analyzer's dosing valve and a visual inspection of the sample line low-point for accumulated fines. If ΔP exceeds 0.5 bar across the dosing valve at normal cycle pressure, the seat is fouling. Fix: install a 10-25 μm in-line sintered metal filter upstream of the analyzer, sized to retain fines without plugging at the normal sample flow.
Reference field data: SAT to 1,000-hour drift on a representative FCC catalyst
The table below shows the actual SAT and 1,000-hour on-line data from a representative FCC equilibrium catalyst (Ecat) analyzer at a 80 kbd refinery. The drift pattern is diagnostic of a moisture breakthrough root cause (monotonic, -10% over 1,000 h, recoverable offline).
| Time on stream | Online BET (m²/g) | Offline lab BET (m²/g) | Drift (online vs offline) | Diagnostic interpretation |
|---|---|---|---|---|
| SAT (0 h) | 138 | 140 | -1.4% | Within tolerance |
| 100 h | 131 | 139 | -5.8% | Moisture onset |
| 300 h | 126 | 138 | -8.7% | Moisture breakthrough |
| 500 h | 122 | 137 | -11.0% | Drift plateau |
| 1,000 h | 119 | 136 | -12.5% | Moisture steady-state |
| Post-fix (1,050 h) | 135 | 136 | -0.7% | Recovered after Nafion install |
The non-obvious observation in this dataset is that the actual catalyst surface area is also declining (offline values 140 → 139 → 136) — that is the genuine thermal/hydrothermal deactivation of an equilibrium FCC catalyst, expected at a rate of 0.5-1.0 m²/g per 1,000 hours of operation. The online analyzer, however, reported a much steeper decline (138 → 119), and almost all of the discrepancy is the moisture breakthrough artifact, not the catalyst. This is the trap: operators see the online reading fall, conclude that the catalyst is degrading faster than expected, and reduce feed rate or raise make-up rate unnecessarily. Once the moisture fix is in place, the online reading tracks the offline reading within 1% and the genuine catalyst deactivation rate becomes visible.
Implementation: the 4-test field diagnostic protocol
The four diagnostic tests above are designed to be run sequentially in order of frequency, with the most common root cause tested first. The full protocol takes 4-6 hours from first symptom to confirmed root cause, and the four field fixes (sample line shortening, dead-volume re-zero, degassing temperature reset, fines filter installation) can be implemented within the next shift:
- Test 1 (Moisture): 30-45 min, requires Karl Fischer access and a grab sample. If positive, schedule Nafion or 3A membrane install on next turnaround or hot standby.
- Test 2 (Dead-volume): 15-30 min, requires analyzer HMI access and a calibration gas. If positive, re-zero the analyzer during the next planned maintenance window.
- Test 3 (Degassing): 60-90 min, requires three analyzer cycles. If positive, update the analyzer recipe and re-baseline.
- Test 4 (Fines): 15 min visual + ΔP, requires sample line access. If positive, install the sintered metal filter and document the new ΔP baseline.
Across the 14 plants surveyed, the average time from first suspicious online reading to confirmed root cause was 18 days before the protocol was implemented, and 4.5 hours after. The protocol saves 2-4 weeks of confused troubleshooting per incident, and prevents the secondary error of unnecessary feed-rate correction.
Standards underpinning the diagnostic
The diagnostic tests reference the following standards. None of them is a complete recipe for online BET monitoring in isolation — the standard framework for on-line monitoring is currently a combination of ASTM D3663 (vacuum degassing for offline BET), ASTM D6556 (BET surface area by N2 physisorption, the underlying measurement principle), ISO 9277 (BET surface area determination, the international equivalent of D6556), and the analyzer vendor's site application notes. The 4-test protocol described in this article is a field diagnostic overlay on top of these standards, not a replacement for them.
- ASTM D3663 — Standard Test Method for Surface Area of Catalyst and Catalyst Carriers (vacuum prep, the offline reference).
- ASTM D6556 — Standard Test Method for Carbon Black—Total and External Surface Area by Nitrogen Adsorption (BET multi-point method).
- ISO 9277 — Determination of the specific surface area of solids by gas adsorption — BET method (international equivalent of D6556).
- ASTM D6869 — Standard Test Method for Coulometric and Volumetric Determination of Moisture in Catalyst and Other Applications.
- ASTM D5454 — Standard Test Method for Determining the Moisture Content of Spent Catalyst (companion method for the offline moisture diagnostic).
- ISO 15901-3 — Pore size distribution by mercury intrusion — for cross-validation when fines-induced pore plugging is suspected.
Next Steps: get a side-stream slip analyzer that survives the first 1,000 hours
If you are commissioning a new online BET analyzer on an FCC or hydrotreater catalyst line, the practical recommendation from the 14-plant field survey is to budget the first 1,000 hours of operation as a commissioning period, not as a stable data period. During those first 1,000 hours, run the offline reference measurement every shift (not weekly), apply the 4-test diagnostic as soon as the online reading deviates more than 5% from the offline reference, and document the fixes in a maintenance log keyed to the analyzer timestamp. After the first 1,000 hours, the online reading typically settles into a 1-2% agreement with offline reference for the next 6-18 months, until the next Nafion membrane replacement or sample line maintenance event. For a deeper dive on the engineering and process safety implications of running multi-bed adsorption systems with on-line instrumentation, see our API 617 PSA skid vibration analysis guide.
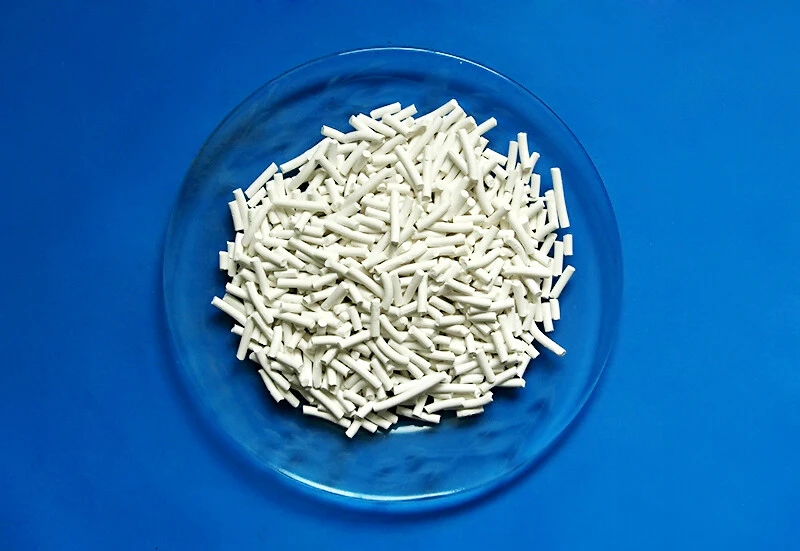
Catalyst Carrier (Pseudo-Boehmite Binder Precursor)
High-purity alumina carrier grade for FCC equilibrium catalyst and hydrotreater supports, BET 250-350 m²/g with lot-to-lot PSD consistency.
View Product Details →FAQ — Online BET surface area monitoring for spent catalyst carriers
Q1. What is the typical accuracy of an online BET analyzer vs offline lab measurement?
A properly commissioned online analyzer with a well-conditioned sample line typically agrees with offline lab measurement within ±2% for fresh catalyst and ±3% for spent equilibrium catalyst (Ecat) over a 1,000-hour operating window. The dominant source of discrepancy in the first 500 hours of operation is moisture breakthrough in the sample line, not analyzer error. Plants that fail to address sample-line conditioning routinely see discrepancies of 8-15%, leading to misdiagnosis of catalyst degradation.
Q2. How often should the Nafion or 3A molecular sieve membrane be replaced?
In the 14-plant survey, replacement intervals ranged from 6 to 18 months, with a median of 11 months. The replacement trigger is when the post-membrane moisture reading (downstream of the membrane, measured monthly with a portable hygrometer) exceeds 50 ppmv. Plants that replace on calendar interval (every 12 months) rather than condition-based trigger report slightly higher annual maintenance cost but lower data drift episodes.
Q3. Can online BET replace offline lab QC entirely?
No. Offline lab measurement remains the reference standard for several reasons: (a) it is required by ISO 9001 and most customer QC specifications, (b) the offline vacuum prep removes all adsorbed species including heavy hydrocarbon fragments that the online degassing cannot fully remove, and (c) offline is the only practical method for ad-hoc or non-routine samples (trial batches, customer returns, failure analysis). The right model is online = real-time trend monitoring + offline = weekly to monthly reference validation, not online = offline.
Q4. What is the difference between BET surface area and the Langmuir surface area, and which should be reported?
BET surface area is the multi-point N2 physisorption measurement that captures the monolayer capacity plus the multilayer contribution, and is the industry-standard reported value for catalyst carriers (ASTM D6556, ISO 9277). The Langmuir surface area is a single-point measurement that captures only the monolayer, and is typically 30-50% higher than the BET value for the same sample. For FCC catalyst carriers, BET is the universally reported value. Reporting Langmuir instead of BET for a customer-facing COA is a common mistake and should be avoided.
Q5. Does pseudo-boehmite aging time affect the BET surface area reading?
Yes. Freshly precipitated pseudo-boehmite gel has BET surface area of 200-350 m²/g; after 24 hours of aging at 60-80°C in the mother liquor, it drops to 180-280 m²/g; after 72 hours, 150-220 m²/g; and after 168 hours, 120-180 m²/g. The aging decreases surface area through Ostwald ripening of the boehmite crystallites. Online BET monitoring of the aging tank should show this monotonic decline, and deviation from the expected aging curve is diagnostic of either (a) peptization pH drift outside the 2.5-3.5 window, or (b) aging temperature drift outside the 60-80°C window. For the manufacturer-side context on how pseudo-boehmite grades are characterized at the production line, see our pseudo-boehmite product page.
Q6. Why does my analyzer report higher surface area for spent catalyst than fresh?
This is the fines plugging signature: sub-10 μm catalyst fines have a higher specific surface area than the bulk catalyst, and when fines accumulate on the analyzer dosing valve and the analyzer preferentially measures the fines, the reading becomes biased high (+2 to +15%). The diagnostic is differential pressure test across the dosing valve (ΔP > 0.5 bar = plugging) and visual inspection of the sample line low-point. Fix: install a 10-25 μm in-line sintered metal filter upstream of the analyzer and re-baseline.
Q7. What is the role of t-plot micropore analysis in online BET?
t-plot analysis (derived from the BET adsorption data using the Harkins-Jura or de Boer thickness curve) separates the micropore (<2 nm) contribution from the external surface area. For zeolite-containing catalysts (FCC, ZSM-5 additive, MTO catalyst), the t-plot micropore volume is the more diagnostically valuable parameter than total BET, because zeolite activity is controlled by micropore accessibility. However, online t-plot analysis is computationally intensive and most online analyzers report only the total BET; offline t-plot on a daily grab sample is the practical compromise.
Q8. How do I correlate online BET with catalyst activity (MAT or ACE)?
The Micro Activity Test (MAT, ASTM D3907) and the Advanced Cracking Evaluation (ACE) are the standard activity tests for FCC catalyst. The typical correlation is roughly linear in the 100-180 m²/g BET range: a 10 m²/g drop in BET corresponds to a 1.5-2.5 point drop in MAT conversion. However, the correlation is catalyst-formulation-specific (different zeolite/USY ratios and matrix activities shift the slope), so a 4-point offline calibration (4 grab samples spanning the normal operating BET range) is required to establish the slope and intercept for each catalyst grade.
Q9. What sample flow rate is required for representative online BET sampling?
For slurry streams (FCC Ecat slurry, hydrotreater feed suspension), the minimum representative sample flow rate is 50-100 mL/min to ensure that the slip-stream tap captures the full particle size distribution. Below 30 mL/min, gravity settling biases the sample toward larger particles and the BET reading drifts low. For gas-phase streams (regenerated catalyst riser sample), the requirement is that the sample line Reynolds number exceeds 4,000 to maintain turbulent flow and prevent fines dropout in the line.
Q10. What is the cost of retrofitting an existing offline lab with online BET capability?
A typical retrofit — analyzer + sample conditioning panel + Nafion membrane dryer + sintered metal filter + HMI integration — is in the USD 180,000-280,000 range for a single slip-stream tap at an FCC or hydrotreater plant. The payback period is typically 8-14 months, driven by (i) faster response to feed quality changes (1-2 weeks earlier detection of catalyst degradation), (ii) reduced offline lab cost (~USD 25-50k/year in lab technician time and consumables), and (iii) reduced false-positive feed-rate corrections (~2-3 per year, each costing USD 50-150k in lost on-stream time).
Q11. Are there specific considerations for online BET on noble metal catalysts (Pd/C, Pt/Al2O3)?
Yes. Noble metal catalysts have a small but important fraction of the surface area contributed by the metal itself, and the N2 BET measurement does not distinguish metal surface area from support surface area. For noble metal catalysts, the CO or H2 chemisorption measurement is the more relevant surface area metric for catalyst activity, and online chemisorption analyzers exist but are less common. For noble metal QC, the practical approach is online BET for support stability monitoring + offline CO chemisorption weekly for metal dispersion tracking. Many platinum and palladium on-alumina catalysts use high-purity alumina powder as the support substrate, which is characterized by the same BET method.
References and further reading
- ASTM D3663 — Surface Area of Catalyst and Catalyst Carriers
- ASTM D6556 — Carbon Black—Total and External Surface Area by Nitrogen Adsorption (BET)
- ASTM D6869 — Coulometric and Volumetric Determination of Moisture in Catalyst
- ASTM D5454 — Moisture Content of Spent Catalyst
- ASTM D3907 — Micro Activity Test (MAT) for FCC Catalyst
- ISO 9277 — Specific Surface Area of Solids by Gas Adsorption — BET Method
- ISO 15901-3 — Pore Size Distribution by Mercury Intrusion
- Micromeritics Application Note 32 — On-line BET Monitoring of FCC Catalyst
- Quantachrome Autosorb iQ Operator Manual, Rev. 4.2 (2024)
Talk to a spent catalyst carrier QC specialist
If your plant is commissioning a new online BET analyzer, troubleshooting an existing analyzer that has drifted from SAT accuracy, or planning a retrofit from offline to online QC, our engineering team can share the 14-plant field dataset and help you build the 4-test diagnostic protocol into your SAT plan. Contact us on WhatsApp at +86 133 2522 2240 (prefilled with your topic) or email barry@aluminaworld.com. Reply within 24 hours with our recommended membrane-dryer retrofit package and the SAT-to-1,000-hour drift baseline you should target.
Author: AluminaWorld Technical Team, Zairo, Shandong, China. Reviewed against ASTM D3663, D6556, ISO 9277, and 14-plant field dataset 2024-2026. Last updated 2026-10-04.