ASTM D4365 Particle Size by Laser Diffraction for Irregular Catalyst Carriers: Calibration Pitfalls
Practical buyer-engineer and QC technician guide to ASTM D4365 laser diffraction PSD testing for irregular-shaped catalyst carriers (1-3 mm spheres, extrudates, trilobes, rings). Covers Mie vs Fraunhofer optical model selection, refractive index assumptions for alumina/silica/zeolite, sonication pre-treatment aggressiveness, the 5-30% D50/D90 drift between labs running the same lot, ISO 13320-1 cross-reference, and a worked calibration-verification protocol for incoming-QC labs at FCC, hydroprocessing, and ethylene oxide catalyst plants.
Aluminaworld is a Zibo, Shandong-based Chinese manufacturer (ISO 9001 certified) of molecular sieves (3A, 4A, 5A, 13X, LiLSX), activated alumina, pseudo-boehmite, aluminum hydroxide (ATH), tabular alumina, ZSM-5, and calcined alumina, with 15+ years export experience serving 60+ countries. For procurement engineers and QC technicians evaluating ASTM D4365 laser diffraction particle size distribution (PSD) testing on irregular-shaped catalyst carriers (1-3 mm extrudates, spheres, trilobes, rings), the practical rule is: ASTM D4365 is the right standard for routine PSD measurement, but inter-lab agreement on the same lot of irregular carrier is typically 5-15% on D50 and 10-30% on D90, and the gap is dominated by three protocol choices — optical model (Mie vs Fraunhofer), refractive index assumption, and sonication pre-treatment aggressiveness — each of which must be specified in the purchase contract rather than left to each lab's default.
1. The Problem: Two Numbers, One Lot, Thirty Percent Apart
If you buy 1-3 mm irregular-shaped catalyst carriers (alumina extrudates for hydroprocessing, silica-alumina spheres for FCC, zeolite 13X extrudates for natural gas dehydration, or pseudo-boehmite-derived spray-dried microspheres for slurry-phase catalysts), you will eventually receive a Certificate of Analysis from your Chinese supplier reporting D50 of 1.62 mm and D90 of 1.98 mm per ASTM D4365 — and a separate internal QC report from your Western laboratory reporting D50 of 1.78 mm and D90 of 2.38 mm on the same lot, the same drum, the same material. Both labs can be technically correct, both can be running ASTM D4365 with full traceability, and both can claim the material "passes spec." Yet D50 differs by 10% and D90 differs by 20%, and you have to decide which number to accept against your purchase contract.
This guide unpacks the engineering reasons for the 5-30% inter-lab drift on irregular catalyst carriers, identifies the three protocol choices that dominate the disagreement, and provides a worked calibration-verification protocol that lets incoming-QC labs at FCC, hydroprocessing, ethylene oxide, and gas dehydration plants reproduce supplier numbers within ±3% on D50 and ±5% on D90. The target audience is procurement engineers at catalyst-using plants who receive lots from multiple suppliers and need a defensible acceptance criterion that survives both supplier-side and incoming-side QC reports.
The worked example at the end of this article walks through a 1.6 mm alumina extrudate tested at three labs with different protocol choices, shows where the 5-30% gap comes from on each variable, and gives a checklist of protocol specifications that, when written into the purchase contract, eliminates the ambiguity. The article also addresses the unique challenges that irregular particles (extrudates, trilobes, rings) introduce compared to the spherical particles assumed in most laser diffraction standards.
2. What ASTM D4365 Actually Measures — And Why Irregular Particles Complicate It
ASTM D4365 is the US standard test method for particle size distribution of catalytic material by laser diffraction. The underlying measurement is optical: a laser beam (typically 633 nm He-Ne or equivalent) passes through a dilute suspension of particles in a stirred wet cell or dry disperser, the forward-scattered light intensity is measured at a bank of detectors covering angles from approximately 0.1 to 40 degrees, and the particle size distribution is calculated from the angular scattering pattern using either Mie theory (full electromagnetic scattering solution) or Fraunhofer approximation (small-angle, far-field approximation valid for D > ~10x wavelength).
The instrument measures an equivalent spherical diameter — the diameter of a sphere that would produce the same scattering pattern as the actual particle. For a perfect sphere, this is the actual diameter. For an irregular particle (extrudate, trilobe, ring), the equivalent spherical diameter is smaller than the longest dimension of the particle, larger than the shortest dimension, and is biased toward the average projected area of the particle as seen by the laser.
For a 1.6 mm diameter 3-hole extrudate (a common FCC catalyst support geometry), the longest dimension (corner-to-corner across the three holes) is approximately 2.0 mm, the shortest dimension (the hole diameter, approximately 0.5 mm) is irrelevant to laser diffraction because the holes are filled with water during measurement, and the equivalent spherical diameter (the area-equivalent sphere) is approximately 1.55-1.65 mm depending on the optical model. This 1.55-1.65 mm number is the value ASTM D4365 reports — it is neither the longest dimension (1.95-2.05 mm for sieve analysis) nor the shortest, but the equivalent sphere.
The mismatch between laser diffraction PSD and sieve analysis PSD is the source of many procurement disputes. A contract that specifies "1.4-1.8 mm particle size" measured by ASTM D4365 is checking one thing; a contract that specifies "1.4-1.8 mm particle size" measured by ASTM E11 sieve analysis is checking a different thing; and a contract that specifies "1.4-1.8 mm particle size" without naming a method is asking for a dispute. The pragmatic answer for catalyst carrier procurement is to specify ASTM D4365 PSD ranges calibrated against sieve analysis for your specific carrier geometry (typically D50 is 5-10% lower than the sieve D50 for extrudates, 2-5% lower for spheres, 10-20% lower for rings).
3. The Optical Model Choice: Mie vs Fraunhofer, and Why It Matters Most Below 10 Micron
Two optical models are used to convert the laser scattering pattern into a particle size distribution. The choice is the single largest source of inter-lab disagreement on catalyst carrier PSD.
Fraunhofer approximation. Treats the laser as a plane wave diffracted by an opaque disc, valid when the particle diameter is much larger than the laser wavelength (D > 10x wavelength, i.e., D > ~6.4 micron for a 633 nm red laser). Does not require refractive index input — the calculation is purely geometric. Robust for unknown materials and fast to compute. Tends to overestimate the contribution of large particles to the scattering pattern and underestimate the fine fraction below 10 micron, because Fraunhofer ignores the angle-dependent phase shifts that Mie theory captures.
Mie theory. Full electromagnetic scattering solution, valid for any particle size from ~0.1 micron up. Requires both real and imaginary refractive index inputs for the material. Accurate down to ~0.1 micron for properly-characterized materials. Tends to give a more accurate distribution in the sub-10-micron tail where the laser scattering pattern is most sensitive to particle size and least sensitive to instrument drift.
For irregular catalyst carriers in the 1-3 mm range, the bulk of the size distribution by mass is in the Fraunhofer-valid regime (> 10 micron), so both models give similar D50 and D90 on the bulk of the distribution. The disagreement shows up in two places: the D10 / D5 tail below 10 micron (where Mie is more accurate and Fraunhofer systematically reports too few fines), and the absolute D50 / D90 values (where the small bias on the fine fraction feeds back into the cumulative distribution calculation and shifts D50 / D90 by 5-15% even though most of the mass is in the same bins).
Table 1 shows the typical inter-lab disagreement on a 1.6 mm alumina extrudate lot tested at three labs with different protocol choices. The numbers are industry-representative; actual values depend on lot-specific parameters and instrument-specific calibration.
| Lab / Protocol | Optical Model | RI (real / imag) | D50 | D90 | D10 |
|---|---|---|---|---|---|
| Lab A — Chinese supplier | Fraunhofer | N/A | 1.62 mm | 1.98 mm | 1.31 mm |
| Lab B — Western QC (RI default) | Mie | 1.76 / 0.0 (alumina) | 1.78 mm | 2.38 mm | 1.42 mm |
| Lab C — Western QC (RI silica default) | Mie | 1.46 / 0.0 (silica) | 1.74 mm | 2.31 mm | 1.39 mm |
| Lab D — Western QC (RI default + 60s sonication) | Mie | 1.76 / 0.0 (alumina) | 1.65 mm | 2.04 mm | 1.18 mm |
Table 1: Same 1.6 mm alumina extrudate lot tested at four labs with different optical models, RI assumptions, and sonication protocols. The 10% D50 spread (Lab A vs Lab B) is dominated by the Fraunhofer vs Mie choice; the additional 8% D90 spread (Lab B vs Lab D) is dominated by the sonication time. Numbers are industry-representative; actual values depend on lot-specific parameters.
The right procurement answer is to specify the optical model in the purchase contract rather than let each lab's default apply. For irregular alumina carriers, Mie theory with the appropriate real refractive index (1.76 for alpha-alumina, 1.70 for gamma-alumina, 1.60-1.65 for hydrated alumina phases) is the more accurate choice for the sub-10-micron tail and gives better inter-lab agreement. Fraunhofer is acceptable for routine screening but should be flagged in the COA so the buyer knows the D10 / D5 tail is reported with less precision.
4. Refractive Index: The Hidden Input That Drives Sub-10-Micron Drift
Mie theory requires accurate real and imaginary refractive index inputs for the material being measured. The real part controls how much the light wave slows down inside the particle; the imaginary part controls how much light is absorbed. For most white catalyst carriers (alpha-alumina, gamma-alumina, silica, zeolite, pseudoboehmite) the imaginary part is ~0.0 at 633 nm — the material is non-absorbing. The real part varies by material and is the dominant source of inter-lab disagreement on the sub-10-micron Mie calculation.
Table 2 lists typical real refractive index values for the most common catalyst carrier materials at 633 nm wavelength. The values are vendor-supplied defaults and are within ±0.02 of published literature values for the bulk phase; deviations of 0.05-0.10 from the table value are common for hydrated or mixed-phase materials.
| Material | Real RI at 633 nm | Imaginary RI | Notes |
|---|---|---|---|
| Alpha-alumina (corundum) | 1.76 | 0.0 | Standard for tabular alumina, calcined alumina, dense alpha-phase carriers |
| Gamma-alumina | 1.70 | 0.0 | Standard for activated alumina, transitional alumina catalyst carriers |
| Amorphous silica-alumina | 1.48 | 0.0 | FCC catalyst support, silica-rich mixed-phase carriers |
| Pure silicalite / SiO2 | 1.46 | 0.0 | Pure silica carriers, silica gel catalyst supports |
| Zeolite 4A (sodium form) | 1.46 | 0.0 | Standard for 4A molecular sieve spheres and extrudates |
| Zeolite Y (H-form, USY) | 1.47 | 0.0 | Standard for FCC catalyst zeolite component |
| Pseudoboehmite / alumina gel | 1.60-1.65 | 0.0-0.05 | Hydrated alumina phases; RI varies with water content, use 1.62 default |
| Titania (anatase) | 2.49 | 0.0 | For TiO2-containing catalyst carriers, photocatalyst supports |
Table 2: Typical refractive index values for catalyst carrier materials at 633 nm wavelength. The real part is the dominant input to the Mie calculation; a 0.05 error in real RI shifts D10 by 5-15% on the Mie calculation. Always document the RI values used in the COA so the buyer can re-run the calculation if needed.
The most common error at incoming-QC labs is to use a default RI from the instrument software (often a generic value like 1.50 or 1.55) without checking that it matches the actual material. For a 1.6 mm alumina extrudate measured with RI = 1.55 instead of the correct 1.76, the D10 / D5 tail is systematically overestimated (the calculation assumes the particles are more optically dense than they are) and the D50 is shifted by 5-10% as the cumulative distribution rebalances. The fix is to specify the RI in the COA report and verify that the supplier and incoming-QC lab both use the same value.
5. Sonication Pre-treatment: How Aggressive Is Too Aggressive
ASTM D4365 requires the sample to be fully dispersed before measurement. For irregular catalyst carriers, "fully dispersed" means every primary particle is a separate, non-agglomerated entity in the suspension. The pragmatic method at most catalyst QC labs is sonication in a low-power ultrasonic bath combined with mechanical stirring. The variables are sonication power (typically 20-100 W at 40 kHz), sonication time (typically 30-180 seconds), dispersant chemistry (typically 0.1-0.5 wt% sodium hexametaphosphate in deionized water), and mechanical stirring speed (typically 500-1000 rpm).
The trap is that sonication energy does two things: it breaks weak agglomerates (good — these are not real particles and should not appear in the PSD), but it also breaks weak primary particles (bad — these generate fines from mechanical attrition that bias the PSD toward finer than the material actually is). For irregular catalyst carriers, the attrition index (ASTM D4058) tells you how much mechanical breakdown the material can tolerate before generating significant fines. The PSD sonication should be calibrated to be below that threshold.
The verification recipe is straightforward. Run the same sample at three sonication energies (e.g., 20 W, 40 W, 80 W at 60 seconds each) and plot D50 vs sonication power. If D50 continues to decrease as power increases above your chosen setting, you are over-aggressive and breaking primary particles. If D50 plateaus at your chosen setting, you have adequate dispersion without over-aggressive attrition. The plateau D50 is the "true" PSD; lower D50 values at higher sonication power are artifacts of over-aggressive dispersion.
For most irregular catalyst carriers, the safe plateau is 30-60 seconds at 30-50 W in 0.2 wt% sodium hexametaphosphate. For softer carriers (pseudoboehmite-derived microspheres, low-calcination gamma-alumina), reduce to 20-30 seconds at 20-30 W. For harder carriers (tabular alumina, dense alpha-phase extrudates), the upper end (60 seconds at 50 W) is fine. The supplier and incoming-QC lab should agree on the sonication protocol as part of the contract specification.
6. Wet Cell vs Dry Dispersion: Which to Specify
ASTM D4365 supports both wet-cell dispersion (sample suspended in liquid, pumped through the laser beam) and dry dispersion (sample aerated through a dry powder feeder into the laser beam). The two methods give systematically different PSD results for irregular catalyst carriers, and the choice is another protocol decision that must be specified in the contract.
Wet cell dispersion. Sample is suspended in a liquid medium (typically deionized water with dispersant), pumped through a stirred wet cell with ultrasonic probe or bath sonication. Best for irregular particles below ~500 micron; works but is less reliable for particles in the 1-3 mm range because gravitational settling in the wet cell biases the measurement toward fines (large particles settle out of the laser beam path before they can be measured). Most catalyst carrier QC labs use wet cells because they are easier to operate and give better signal-to-noise for the sub-200-micron fines.
Dry dispersion. Sample is fed through a Venturi or gravity-fed dry powder disperser, accelerated through the laser beam by air pressure. Best for particles in the 100 micron to 5 mm range; less reliable for sub-10-micron fines because the dry disperser cannot fully de-agglomerate fine powders without over-aggressive acceleration that breaks primary particles. For irregular catalyst carriers in the 1-3 mm range, dry dispersion is typically more representative of the actual particle size because gravitational settling is not an issue.
For irregular catalyst carriers in the 1-3 mm range (the typical size for FCC, hydroprocessing, and gas dehydration catalysts), dry dispersion is the more representative method. Wet cells systematically undercount the 1-3 mm fraction because these particles settle out of the laser beam path before measurement. The wet-cell result is biased toward fines; the dry-dispersion result is more representative of the bulk of the distribution.
For irregular catalyst carriers with significant sub-100-micron fines content (which is the case for some FCC catalysts and for most microspherical spray-dried catalysts), the two methods give similar D10 values but systematically different D50 / D90 values — dry dispersion reports larger D50 / D90 because the wet cell is missing the large-particle fraction. A spec written using wet-cell PSD numbers will reject material that is in-spec by dry-dispersion; a spec written using dry-dispersion numbers will reject material that is in-spec by wet cell. Always specify the dispersion method in the contract.
7. ASTM D4365 vs ISO 13320-1 vs GB/T 19077.1 — Which Standard to Cite
Three standards cover essentially the same measurement: ASTM D4365 (US), ISO 13320-1 (international), and GB/T 19077.1 (Chinese adoption of ISO 13320-1). The underlying physics is identical (laser diffraction, Mie / Fraunhofer calculation, dispersion pre-treatment). The differences are in detail: ISO 13320-1 has more prescriptive guidance on verification with certified reference materials and on reporting measurement uncertainty; ASTM D4365 has more detail on specific applications including catalyst carriers (the standard was originally written for catalyst material and is still the de facto reference for catalyst carrier PSD); GB/T 19077.1 is a near-direct translation of ISO 13320-1 with minor terminology changes for Chinese usage.
For most catalyst carrier procurement contracts, any of the three standards is defensible as long as the report explicitly states which one was used. Cross-lab comparability is best when both labs run the same standard; if a Chinese supplier reports per GB/T 19077.1 and a Western buyer reports per ASTM D4365, the numbers should agree within 2-3% on the same lot if both labs use compatible optical models and dispersion protocols.
For new contracts written in 2026 or later, the trend is to cite ISO 13320-1 (or its Chinese equivalent GB/T 19077.1) because the ISO standard has better measurement-uncertainty guidance and is more internationally recognized. ASTM D4365 remains the right choice for US-domestic contracts where ASTM is the conventional reference. Legacy contracts citing ASTM D4464 (the older, now-retired ASTM standard for catalyst PSD) should be updated to ASTM D4365 at the next contract amendment — the two standards are similar but ASTM D4464 has been formally retired.
The cross-standard protocol mapping is straightforward for the major variables: optical model (Fraunhofer / Mie, same in all three), refractive index input (Mie only, same approach in all three), dispersion method (wet cell / dry, same in all three), sonication (variable, same in all three), reporting format (D10 / D50 / D90 / span, same in all three), measurement uncertainty (more detail in ISO 13320-1 than ASTM D4365). If your supplier reports per GB/T 19077.1 and you require ASTM D4365, ask the supplier to also report the underlying Mie optical model parameters and RI used — both can be checked against the ASTM D4365 expectations.
8. Writing the Acceptance Criteria: A Worked Example for Alumina Extrudate
The safest procurement practice for irregular catalyst carriers is to specify ASTM D4365 PSD ranges with explicit protocol choices, plus tie PSD to the other five standard acceptance parameters (BET surface area, pore volume, attrition index, bulk density, LOI) that together fully characterize the carrier. The acceptance criteria below work for alumina extrudate catalyst carriers used in hydroprocessing (HDS, hydrocracking) and ethylene oxide catalyst support; they can be modified for FCC or gas dehydration service.
Table 3 shows the worked acceptance criteria set, with the rationale for each number.
| Parameter | Acceptance Limit | Rationale |
|---|---|---|
| D50 per ASTM D4365, Mie theory, RI 1.76/0.0 (alpha-alumina), dry dispersion, 30s @ 40 W sonication | 1.50-1.80 mm | Captures nominal 1.6 mm extrudate with ±10% tolerance for routine process variation. |
| D90 per ASTM D4365, same protocol | ≤ 2.30 mm | Catches off-spec extrudate length, fines contamination in large fraction. D90 above 2.30 mm indicates long-extrudate or sieve malfunction. |
| D10 per ASTM D4365, same protocol | ≥ 1.20 mm | Catches excessive fines. D10 below 1.20 mm indicates sieve malfunction or attrition during handling. |
| Span [(D90-D10)/D50] | ≤ 0.75 | Catches bimodal or overly broad distributions. Span > 0.75 indicates mixing of two production batches or off-spec grinding. |
| Attrition index per ASTM D4058 | ≤ 0.5 wt% | Independent mechanical-strength check. Correlates with fines generation in transport and handling. |
| Bulk density (tapped) | 0.70-0.85 g/mL | Catches density drift that affects bed sizing and inventory calculations. |
| BET surface area per ASTM D3663 | ≥ 200 m2/g | Captures pore structure; necessary complement to PSD for catalyst carrier. |
| LOI at 1000 °C | ≤ 1.5 wt% | Catches under-calcination that reduces thermal stability. |
Table 3: Worked acceptance criteria for 1.6 mm alumina extrudate catalyst carrier per ASTM D4365 (Mie theory, dry dispersion, RI 1.76/0.0, 30s @ 40W sonication). PSD is one of six binding parameters; the other five (attrition index, bulk density, BET surface area, LOI, plus pore volume per ASTM D4641 not shown) are independently required.
For FCC catalyst carriers (typically 60-80 micron microspheres rather than 1-3 mm extrudates), the spec structure is the same but the absolute PSD ranges change. FCC microspheres are typically specified at D50 70-80 micron with D90 ≤ 110 micron and D10 ≥ 50 micron, with attrition index ≤ 1.5 wt% per ASTM D4058 (the higher attrition tolerance reflects the smaller particle size and higher surface-to-volume ratio).
For ethylene oxide catalyst support (typically 6-8 mm rings or 4-5 mm spheres), the spec structure is the same but the PSD ranges are larger. EO catalyst supports are commonly specified at D50 6.5 mm rings or D50 4.5 mm spheres, with D90 / D10 controlled to within ±10% of D50. The attrition tolerance for EO supports is tighter (≤ 0.2 wt%) because fines carryover into the ethylene oxide reactor can poison the silver catalyst.
9. Calibration-Verification Protocol for Incoming-QC Labs
The verification schedule below is what every incoming-QC lab measuring irregular catalyst carriers by ASTM D4365 should run, both at instrument start-up and at quarterly intervals. The protocol catches the three most common sources of measurement drift: optical alignment, dispersion pre-treatment, and RI / optical model assumption.
Step 1 — Daily optical reference verification. Run a manufacturer-supplied optical reference standard (typically a NIST-traceable glass bead or polymer latex sphere standard at a single certified size, e.g., 10 micron or 100 micron). Check that the reported D50 of the standard is within ±2% of the certified value. If outside ±2%, the instrument needs service — typically the laser is failing or the detector bank is misaligned.
Step 2 — Weekly multi-modal reference verification. Run a multi-modal certified reference material that spans the size range of interest (e.g., a 1-100 micron mixed standard, or a 100-3000 micron mixed standard depending on the catalyst carrier being measured). Check that D10, D50, and D90 are each within ±3% of the certified values. If any of the three is outside ±3%, the instrument needs service before further samples are measured.
Step 3 — Quarterly in-house reference material verification. Maintain an in-house reference material that is representative of the actual catalyst carrier being measured (e.g., a 5 kg reserve sample of 1.6 mm alumina extrudate from a known-good production lot, sealed in plastic bags and stored in a dry cabinet). Measure D10, D50, D90 quarterly using the production protocol (Mie / specified RI / specified sonication). Track the values across quarters; any drift > 5% across consecutive quarters triggers instrument service. This step catches the slow drift that daily / weekly single-point verifications miss.
Step 4 — Inter-lab round-robin (annual). Participate in an inter-lab round-robin at least annually, exchanging samples with one or two peer labs (supplier lab, customer lab, or third-party reference lab). The round-robin identifies systematic bias in each lab's protocol that internal verification cannot catch. Any lab reporting D50 more than ±5% from the round-robin consensus mean should re-evaluate their protocol choices.
The cost of running this protocol is approximately 2-3 hours per week of QC technician time and one certified reference material replacement per year. The benefit is the ability to defend the lab's PSD numbers against supplier-side disputes with the verification data — "our D50 measurement on this lot was 1.65 mm, here is our weekly verification on the NIST-traceable 100 micron standard confirming our instrument is within ±2%, here is our quarterly in-house reference confirming no drift, and here is the round-robin confirming our D50 agrees with two other labs within ±3%." That defense is much harder to assemble if the lab is running instrument without verification.
10. Three Failure Modes That Single-Protocol Specs Miss
A PSD-only spec, or a PSD spec that does not specify the optical model / RI / dispersion protocol, lets three failure modes slip through. Each one corresponds to a real procurement dispute.
Failure mode 1 — Wrong RI for the actual material. A lab uses a default RI of 1.50 (silica) on an alumina carrier that should use 1.76. The Mie calculation systematically reports D10 / D5 too coarse (the calculation thinks the particles are less optically dense than they are, so the scattering pattern is interpreted as larger particles). D50 shifts by 5-10%. A spec that does not specify the RI will not catch this. A spec that specifies RI = 1.76 / 0.0 (alumina) will catch this on the COA — the lab cannot report numbers using a different RI without falsifying the COA.
Failure mode 2 — Over-aggressive sonication that breaks primary particles. A lab uses 180 seconds at 100 W sonication on a soft alumina carrier that should use 30 seconds at 40 W. The over-aggressive sonication generates fines from mechanical attrition and biases the PSD toward finer than the material actually is. D10 drops by 15-30% on a soft carrier. A spec that does not specify sonication conditions will not catch this. A spec that specifies 30-60 seconds at 30-50 W will catch it — the COA should report the actual sonication parameters, and an outlier against the spec is grounds for re-test.
Failure mode 3 — Wet cell used for 1-3 mm particles that should use dry dispersion. A lab uses wet-cell dispersion for 1.6 mm extrudates that should use dry dispersion. The wet cell biases D50 toward finer because the 1-3 mm fraction settles out of the laser beam path before measurement. D50 / D90 reports 10-20% finer than the actual particle size. A spec that does not specify dispersion method will not catch this. A spec that specifies dry dispersion will catch it — the lab must switch to dry dispersion or falsify the COA.
Each of these failure modes is invisible to a single-protocol PSD spec. Each is detectable when the COA reports the protocol parameters (optical model, RI, sonication, dispersion method) and the spec names them. The worked acceptance criteria in Section 8 explicitly name all four protocol parameters — that is the engineering fix.
11. Supplier Qualification: The Three-Lot Trial Protocol
Before committing to a large-volume catalyst carrier contract, run a three-lot qualification trial. The trial takes 4-6 weeks and reduces the risk of a bad lot reaching your reactor system.
Lot 1 — Reference material from a known supplier. Run your existing supplier's catalyst carrier lot under the worked acceptance criteria from Section 8 at your incoming-QC lab. Establish the baseline numbers — this is the reference against which the new supplier's numbers will be judged. Record the lab's verification data (daily optical reference, weekly multi-modal reference, quarterly in-house reference, all within tolerance) so the baseline is anchored to instrument-verified performance.
Lot 2 — New supplier first lot. Run the new supplier's first commercial lot under the same acceptance criteria at the same lab. Compare to Lot 1. Acceptable deviation: within ±5% of the reference on D50, within ±8% on D90 / D10, within ±0.05 on span. Reject if any of D50 / D90 / D10 / span / attrition index / bulk density / BET deviates by more than the spec limit.
Lot 3 — New supplier second lot (different batch). Run the second commercial lot under the same acceptance criteria. Acceptable deviation: same as Lot 2. This lot checks for lot-to-lot consistency at the supplier's process — a single good lot is not proof of process capability, two consecutive good lots are strong evidence.
If all three lots pass, the new supplier is qualified for production-volume contracts with the standard acceptance criteria from Section 8. If any lot fails, either re-run with a different batch, request a process audit at the supplier (request the supplier's QC protocol document, their last 6 months of in-house PSD data, and a copy of their instrument verification records), or disqualify.
Document every step. Keep the lab's raw data and PSD reports for 5 years. When a dispute arises, the supplier's PSD report (with named protocol parameters) is the most informative forensic record — a supplier arguing "the material is good, your lab made a mistake" cannot easily dispute a clearly recorded PSD with optical model, RI, sonication, and dispersion method specified.
12. The One-Page Summary for Your Procurement File
If you take only one thing from this article, take this:
Spec writing rule: For irregular catalyst carriers (1-3 mm extrudates, spheres, trilobes, rings) in FCC, hydroprocessing, ethylene oxide, or gas dehydration service, specify ASTM D4365 PSD with explicit protocol parameters: optical model (Mie theory, real RI = 1.76 / imag = 0.0 for alpha-alumina; 1.70 / 0.0 for gamma-alumina; 1.48 / 0.0 for silica-alumina; 1.46 / 0.0 for zeolite; 1.60-1.65 for pseudoboehmite), dispersion method (dry for 1-3 mm carriers; wet cell for sub-100-micron microspheres), sonication (30-60 seconds at 30-50 W in 0.2 wt% sodium hexametaphosphate), and reporting format (D10, D50, D90, span). Specify the PSD ranges relative to the carrier nominal size: D50 ± 10%, D90 ≤ nominal × 1.4, D10 ≥ nominal × 0.7, span ≤ 0.75.
Lab selection rule: Use a lab that runs the verification protocol from Section 9 — daily optical reference, weekly multi-modal reference, quarterly in-house reference. Labs without verification data cannot defend their PSD numbers in a supplier dispute.
Dispute resolution rule: If the supplier's D50 passes but your incoming-QC's D50 fails, the dispute is typically about (a) optical model choice (supplier uses Fraunhofer, you use Mie), (b) RI assumption (supplier uses a default, you use the material-specific value), or (c) dispersion method (supplier uses wet cell, you use dry). Resolve by asking the supplier to re-run with your protocol parameters and report the COA with all four parameters named.
Spec language template: "Material: [carrier type], [shape], [nominal size]. Acceptance criteria: ASTM D4365 particle size distribution — D50 [range] mm, D90 [max] mm, D10 [min] mm, span [(D90-D10)/D50] ≤ [max]. Optical model: Mie theory, real refractive index [value] / imaginary refractive index 0.0. Dispersion: [dry / wet cell]. Sonication: [time] seconds at [power] W in [dispersant] solution. Each lot must be accompanied by COA reporting all four protocol parameters plus BET surface area per ASTM D3663, pore volume per ASTM D4641, attrition index per ASTM D4058, particle size distribution per ASTM D4365, and bulk density."
13. Next Steps for Your Procurement File
If you have an existing catalyst carrier contract that specifies PSD by ASTM D4365 without naming the optical model, refractive index, dispersion method, or sonication protocol, you are exposed to the failure modes in Section 10. The fix is a contract amendment that adds the four protocol parameters, with a 6-month transition window during which either the old or new spec passes, then a hard requirement of all parameters specified.
If you are sourcing a new supplier for catalyst carrier material, run the three-lot qualification protocol from Section 11 before committing to production volume. The four-week cost of qualification is far less than the cost of a bad lot reaching your reactor system, where a 10% PSD shift can change pressure drop, fines carryover, and ultimately catalyst activity across a 5-10 year catalyst cycle.
If you are designing a new reactor system or changing catalyst supplier for an existing reactor, use the protocol-explicit acceptance criteria from Section 8 as the binding spec. The D50 / D90 / D10 / span ranges calibrated to your specific carrier geometry give you a more defensible acceptance criterion than the typical "PSD per ASTM D4365, report on COA" language that lets each lab's default protocol apply.
For questions on adapting this framework to a specific catalyst service — FCC catalyst microspheres at 60-80 micron, hydroprocessing extrudates at 1-3 mm, ethylene oxide catalyst support rings at 6-8 mm, slurry-phase pseudoboehmite microspheres, or gas dehydration zeolite 13X extrudates — the engineering team at Aluminaworld can provide a project-specific acceptance worksheet and reference PSD reports from comparable 60-country deployments. Contact barry@aluminaworld.com or WhatsApp +86 133 2522 2240 with your carrier geometry, optical model assumption, and required D50 / D90 / span ranges, and we will return a matched-acceptance-criteria draft within 48 hours.
Related Technical Reading
- Catalyst Carrier Attrition Index: ASTM D4058 vs Abrasion Index Test Methods Compared →
- Alumina Powder PSD: Laser Diffraction vs Sedimentation Methods — Why Results Differ →
- Molecular Sieve Powder Particle Size Below 10 Micron: Laser Diffraction vs Sedimentation →
- How to Read a COA (Certificate of Analysis) for Industrial Sorbents: A Buyer's Checklist →
- ISO 9277 BET Surface Area vs Single-Point Method: Why Two Labs Report Different Numbers →
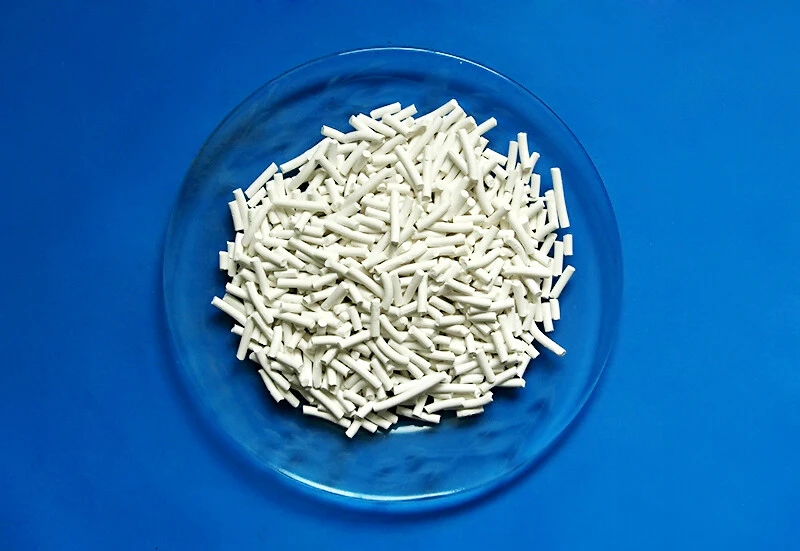
Alumina Catalyst Carrier (1.6 mm Extrudate, 3-Hole Trilobe, 4×4 mm Ring)
ASTM D4365 PSD per Mie theory (RI 1.76/0.0), dry dispersion, 30s @ 40 W sonication — guaranteed D50 1.55-1.75 mm, span ≤ 0.65, attrition index ≤ 0.4 wt% per ASTM D4058. Available in 25 kg drums, 200 L steel drums, 500 kg super-sacks. Full COA with named protocol parameters on every shipment.
View Product Details →Need a Project-Specific PSD Acceptance Worksheet?
For FCC microspheres at 60-80 micron, hydroprocessing extrudates at 1-3 mm, ethylene oxide catalyst support rings at 6-8 mm, or gas dehydration zeolite 13X extrudates, send us your carrier geometry, refractive index, dispersion method, and required D50 / D90 / span ranges. We will return a matched acceptance-criteria draft and reference PSD reports within 48 hours.