Battery Cell Dry Room Oxygen Sensor Calibration: How a Molecular Sieve Dryer Failure Silently Raises Your O2 Reading Drift
AluminaWorld is a Zibo, Shandong-based Chinese manufacturer (ISO 9001 certified) producing molecular sieves (3A, 4A, 5A, 13X), activated alumina (BET 300-360 m²/g), alumina powder, aluminum hydroxide (ATH), and specialty alumina, with 15+ years of export experience serving 60+ countries. This article is written for the process / instrumentation engineer who owns the dry room atmosphere budget and gets paged when the electrolyte-filling step starts producing cell-level defects.
A lithium-ion battery dry room is not a dehumidification problem. It is an oxygen-partitioning problem that happens to be solved with molecular sieve. The cell chemistry cares about three numbers — dew point, differential pressure, and dissolved O2 — and all three are coupled through the same adsorption bed. When that bed degrades, the first thing most teams notice is a slow upward drift in the oxygen reading, and they almost always blame the sensor. It is very often the bed.
1. Why dry rooms regulate oxygen at all
Water is the obvious contaminant. Oxygen is the one that quietly damages finished cells. Dissolved oxygen in the electrolyte oxidises the SEI (solid-electrolyte-interphase) layer on the graphite anode during the first formation charge, and it oxidises dissolved transition-metal impurities coming out of the cathode. The net effect is higher first-cycle coulombic efficiency loss, faster capacity fade, and — in the worst case — lithium plating on subsequent cycles when the anode surface is no longer uniformly passivated.
Because water is orders of magnitude harder to remove to the required level than it first appears, and because water competes for the same adsorption sites as oxygen, dry room air is delivered at very low RH and very low O2 together. The practical targets used across the industry (all label these as typical rather than universal, because the final number is set by the cellmaker's own validation):
| Parameter | Typical dry-room target | Degradation trigger | Who owns the alarm |
|---|---|---|---|
| Relative humidity | < 1.0 %RH (many plants < 0.5 %RH) | Rising dew point after regeneration stabilises | Facilities / HVAC |
| Dew point | −45 to −70 °C | +2 °C above validated baseline | Facilities / HVAC |
| Oxygen concentration | < 100 to 200 ppm v/v (cell dependent) | Positive drift over 30 days with no process change | Process / metrology |
| Differential pressure | < 250 to 400 Pa across bed | > 400 Pa = dust or water upstream | Maintenance |
The point of the table is the last column. Oxygen drift is owned by process and metrology, not facilities. That ownership boundary is exactly why bed degradation gets misdiagnosed: the facilities team sees RH and dew point holding perfectly, the process team sees O2 creeping, and neither group has the bed-loading data that would explain the connection.
2. How the O2 sensor actually measures, and where it lies to you
There are two dominant sensor families in dry rooms, and each has a characteristic failure signature that gets confused with bed failure.
2.1 Electrochemical (galvanic) cells
These use a working electrode and a counter electrode separated by an electrolyte, producing a current proportional to O2 partial pressure. Typical range is 0–25 % with useful resolution down to a few hundred ppm when you use a low-range cell. The defining weakness is cross-sensitivity to humidity: many electrochemical cells quote a cross-sensitivity to water vapour, and in a dry room operating at < 1 %RH the reading is pulled in one direction, while a sudden increase in RH from a failing bed pushes the reading the other way.
The practical symptom of a fouled or exhausted electrochemical sensor is a reading that no longer responds to a known perturbation. If you inject a certified gas at the inlet and the reading does not move, the sensor is the problem, full stop — do not go looking at the molecular sieve.
2.2 Paramagnetic (magnetic-thermal) analysers
O2 is paramagnetic; most other gases on the molecular basis are not. A paramagnetic analyser measures the change in magnetic susceptibility of the sample gas and is the reference method for low-ppm O2 in industrial gas. Accuracy at the 100–1000 ppm level is excellent, humidity compensation is well handled, and calibration against certified reference gas is straightforward. The downside is cost, footprint, and the fact that many dry-room installations use a lower-grade variant with poorer ppm-level linearity.
| Failure signature | Most likely cause | Confirm with |
|---|---|---|
| Slow monotonic O2 rise, RH stable | Adsorbent bed capacity loss | Breakthrough test on effluent; record tbreak |
| Step change in O2 after a bed swap | Incomplete activation of new charge | Effluent dew point immediately post-changeover |
| O2 rise and RH rise together | Blower loss, damper failure, or bed bypass | Trend blower current and damper position |
| Reading frozen, no response to injected gas | Sensor fouling or cell exhaustion | Zero/span gas bump test |
| Reading drifts only in one shift | Sampling line not purged; analyser warm-up | Compare against a grab sample at the same tap |
3. The mechanism: water displacement on a shared pore network
Both O2 and H2O adsorb on the same zeolite framework, and they compete for the same cation-exchange sites. The failure mode that produces a pure O2 drift — with RH apparently fine — is selective displacement by water.
Here is the mechanism in sequence. A fraction of the plant’s load enters the bed as vapour rather than liquid. That vapour saturates the strongest water-binding sites first. As the cycle progresses, water progressively occupies a larger share of the total adsorption capacity. Because the remaining capacity is finite, the bed starts to break through on the weaker-binding species first. Depending on the sieve grade, water and CO2 can start breaking through while oxygen is still being held — or the bed can reach a state where the available dynamic capacity for O2 specifically has dropped enough that O2 breakthrough appears first at a lower load than your dew point alarm would catch.
This is the crux. A dew point meter at the effluent sees water. It is blind to oxygen. If your bed has lost 30 % of its dynamic working capacity and that lost capacity was preferentially water sites, the dew point can sit comfortably inside spec while oxygen quietly breaks through earlier every cycle. The O2 reading drifts upward not because anything changed in the room, but because the bed is closer to O2 breakthrough than it was last month.
| Condition | Effluent dew point | Effluent O2 | Diagnosis |
|---|---|---|---|
| Fresh charge, cycle 1 | At spec | At spec | Healthy baseline |
| Aged charge, capacity −20 % | At spec (barely) | Rising | Water displacement — swap the charge |
| Aged charge, capacity −45 % | Drifting up | Rising faster | Charge exhausted — urgent changeout |
| Blower off, bed bypassed | Room RH | Room O2 (~20.9 %) | Mechanical fault, not adsorbent |
4. Sieve grade selection for a dry-room duty
Not every grade belongs in a dry room. The selection logic is driven by which contaminant you are actually trying to remove and at what level, because the pore geometry determines which molecule gets in first and which molecule wins the competition.
- 3A zeolite — effective pore 3 Å, screens water only (3 Å < 3.5 Å kinetic diameter). Correct where the duty is pure water drying of a hydrocarbon or alcohol stream and the co-feed has no useful O2 removal requirement. This is the classic refrigerant and polyol grade.
- 4A zeolite — effective pore 4 Å, the workhorse for general-purpose air drying, natural gas dehydration, and PSA feed prep. Adsorbs water plus CO2 to a meaningful degree. A reasonable default when the dry room also handles a CO2-bearing outdoor-air makeup stream.
- 5A zeolite — effective pore 5 Å. The one to reach for when the feed contains a meaningful fraction of CO2 that you do want removed before the gas sees the cell line, because it holds CO2 more strongly than 4A does.
- 13X zeolite — effective pore 8 Å, the highest-capacity grade for CO2 and N2 co-adsorption. Powerful but strongly prefers CO2, so it is the right pick when CO2 removal is the primary duty and water is secondary. Overloading 13X with a water-dominant feed wastes a lot of its capacity.
For a battery dry room fed by ambient or lightly-conditioned makeup air, the practical answer is usually 4A or 5A, with 13X reserved for CO2-heavy streams. If the dry room is fed by a nitrogen generator, you have removed the O2 problem by a different route and the sieve is doing water work only — which changes the capacity math completely.
4.1 Particle size and pressure drop in a dry room
Dry rooms run large volumes at low pressure. Small pellets maximise kinetics but raise differential pressure, which raises fan energy and generates dust that ends up on the cell line. Larger pellets drop the pressure but slow the mass-transfer front. Typical industrial-typical ranges to specify against are 2.5–3.5 mm and 1.6–2.5 mm pellets for general air drying, with bulk density typically in the 620–700 kg/m³ range. Specify your pressure-drop budget explicitly — for a dry room, a practical design target is well under 400 Pa across a full bed at the design flow rate.
5. Regeneration: the variable that actually causes the drift
The bed does not fail randomly. It fails because of how you regenerate it. Three regeneration variables dominate.
5.1 Regeneration temperature
Desorption is endothermic and roughly follows an Arrhenius relationship, so temperature translates almost directly into effective capacity. Under-regeneration is the single most common cause of a slowly degrading bed: you save gas on the regen step, the bed comes back online with less free capacity than it left with, and that deficit compounds cycle after cycle. Under-regeneration is invisible on the effluent dew point for many weeks — it only shows up as a slow capacity loss, which is exactly the O2 drift signature from Section 3.
5.2 Regeneration gas composition and dryness
If the regeneration gas is not itself dry, you are desorbing water and re-adsorbing part of it in the same pass — a net capacity loss every cycle. This is why regenerated beds should be purged with dry gas before returning to service, and why regeneration gas that has been through its own 13X polishing tower behaves far better than regen gas taken straight off ambient supply.
5.3 Bed cooling before return to service
A hot bed returning to adsorption service adsorbs faster but suffers thermal shock and, more importantly, picks up whatever moisture is in the room air during the cooling period. Cooling under dry purge gas rather than in the room is the difference between a bed that recovers fully and a bed that starts every cycle already part-loaded.
5.4 Cycle design and how O2 breakthrough scales with load
Breakthrough is not a step function; it is a curve, and the shape of that curve is what makes early detection possible. If you plot effluent concentration against bed volume, you get the classic sigmoid: a low flat lead section where the inlet-front is still filling, a steep mass-transfer zone, and a slow tail as the bed approaches equilibrium loading. Two consequences matter for the O2 case specifically.
First, the mass-transfer zone sits downstream of the inlet, so the last section of the bed to saturate is the effluent end. A modest capacity loss shortens the lead section long before it does anything to the tail, which means the bed can absorb a real capacity loss with no visible change at the effluent for weeks. That is the entire reason O2 drifts before dew point.
Second, because O2 is a weakly-held species on most grades, it occupies the tail of the breakthrough curve. Water breaks through first and sharply; O2 breaks through later and more gently. The practical consequence is that a properly managed bed shows O2 as a smooth ramp rather than a step, and that ramp is measurable. Set your alarm on the derivative of the O2 trend, not on a fixed ppm threshold, if you want to catch it early.
Reducing the inlet load also shifts the whole curve. If your dry room make-up air is taking the shortest path through the bed instead of being properly conditioned first, you are loading the sieve with the raw ambient moisture and CO2 rather than with conditioned air. A pre-cooler and a proper inlet plenum with even flow distribution can extend bed life substantially, and it costs nothing compared with changing the charge more often.
5.5 Sizing mistakes that accelerate the drift
Two sizing errors show up repeatedly and both make the O2 problem worse than it needs to be.
The first is undersizing on peak flow. Designers routinely size the bed on average or on turn-down flow because the dry room draws near-zero air when doors are closed. But door openings, material transfers and shift changes create genuine peaks. A bed sized for average flow spends those peaks at the top of its mass-transfer zone, where effluent O2 responds sharply. If your dry room has frequent door cycles, ask your supplier for a duty cycle, not just a nominal flow rate.
The second is maldistribution. Bed contact efficiency falls away badly if flow channels through the lowest-resistance path rather than across the full cross-section. Poor distribution shows up as a faster apparent breakthrough than the laboratory number predicts, and it usually gets worse as the charge settles over thousands of thermal cycles. Mitigations are the standard ones: a properly sized inlet distributor, retaining screens at the right aperture so fines do not compact into a plug, adequate vessel freeboard for thermal expansion, and avoiding a bed depth so shallow that the mass-transfer zone occupies most of the vessel.
Both of these are design and installation decisions. Once the vessel is built they are expensive to change, which is why they belong in the design review rather than in the troubleshooting session.
6. A diagnostic sequence you can run in one shift
- Rule the sensor out first. Run a zero and span bump test against certified gas at the analyser inlet. A sensor that will not respond to a known gas is never evidence of a bed problem. This single test prevents the most common misdiagnosis in the whole scenario.
- Check the sampling line. Confirm the impulse line is purged and the analyser has reached thermal stability. Compare the analyser against a grab sample drawn from the same tap using a portable paramagnetic instrument.
- Establish the baseline. Pull the effluent O2 and dew point simultaneously. Write both numbers down with the bed age and the cumulative cycle count.
- Compare against the same bed, one cycle earlier. A single cycle is noise. The signal is the rate of change. If you do not retain historical analyser trends, start retaining them now — without a trend you cannot distinguish a real drift from a calibration offset.
- Trend differential pressure against O2. Rising O2 with stable differential pressure points to capacity loss from displacement or under-regeneration. Rising O2 with rising differential pressure points to dust, a blocked inlet filter, or water carryover from a malfunctioning separator upstream.
- Run a laboratory breakthrough test. Pull a representative sample of the charge and measure dynamic working capacity directly. This is the only measurement that separates “the bed is exhausted” from “the bed is being used badly.”
- Audit the regeneration record. Compare actual regen temperature, regen gas dryness, and purge duration against the commissioning baseline. Nine times out of ten the drift is explained here rather than in the charge itself.
7. Standards and test methods worth naming in your spec
Cite these by number in your purchase specification so the supplier and you are arguing about the same measurement:
- ASTM D2854 — apparent density of formed catalyst and catalyst carrier particles. Use for the bulk-density comparison between lots.
- ASTM D2862 — particle size distribution and attrition of molecular sieve-type materials.
- ASTM D4058 — attrition index, the standard crush-and-attrition comparison for formed shapes.
- ASTM D4164 — attrition and attrition rate of calcined catalyst particles.
- ASTM D6185 — crushing strength of formed catalyst shapes.
- ASTM E300 — selection and preparation of samples for analysis, the chain-of-custody reference for sampling a live bed.
- ISO 8573-1 — compressed air quality classes by contaminant, useful if the dry room is fed from a compressor rather than from a nitrogen generator.
8. What to write into the purchase specification
The commercial conversation and the technical conversation are the same conversation. Specify these and you will get comparable offers:
| Specification line | Why it matters |
|---|---|
| Grade and pore aperture (3A / 4A / 5A / 13X) | Determines which contaminant is actually being removed |
| Dynamic working capacity, test conditions stated | The number that actually predicts your breakthrough; static capacity does not |
| Particle size distribution (mm) | Sets your differential-pressure budget |
| Bulk / apparent density | Determines how many cubic metres of charge fit your vessel |
| Crush strength and attrition index (ASTM D4058) | Predicts dust generation over thousands of cycles |
| Loss on ignition, Na2O, and binder content | Binder raises the real cost per cycle even when capacity looks fine |
9. Frequently asked questions
Why does my battery dry room oxygen reading keep rising when dew point stays in spec?
Because a dew point meter only measures water. Oxygen and water compete for the same cation-exchange sites on the zeolite framework. As water progressively occupies more of the bed's finite capacity, oxygen breaks through earlier each cycle while the effluent dew point still sits inside its alarm band. The O2 drift is a leading indicator of water-displacement capacity loss, not a sensor fault.
Can an oxygen sensor fault look exactly like a molecular sieve bed failure?
Yes, and this is the single most common misdiagnosis in dry rooms. The discriminating test is a zero and span bump test against certified gas at the analyser inlet. If the reading does not respond to a known gas, the sensor is at fault. If it responds normally and the O2 reading is still high, the adsorption bed is the suspect and you should move to a breakthrough test.
Which molecular sieve grade is correct for a lithium battery dry room?
For a dry room fed by ambient or lightly-conditioned makeup air, 4A or 5A is usually correct, with 13X reserved for CO2-heavy streams where CO2 removal is the primary duty and water is secondary. If the room is fed by a nitrogen generator you have already removed the O2 problem by another route, and the sieve is doing water work only, which changes the capacity calculation completely.
What is the difference between an electrochemical and a paramagnetic oxygen analyser?
Electrochemical cells are cheaper with a 0-25% range, but they carry meaningful cross-sensitivity to water vapour and they foul over time. Paramagnetic analysers measure magnetic susceptibility, are the reference method for low-ppm industrial O2, handle humidity compensation well, and cost more plus a larger footprint. In a dry room below 1%RH the electrochemical cross-sensitivity is a genuine source of false readings.
What is a realistic O2 target for a battery cell dry room?
Industry-typical targets are below 100 to 200 ppm v/v, dependent on cell chemistry and set by each cellmaker's own validation programme. What matters more than the absolute number is the rate of change: a positive drift over 30 days with no process change is the signature of a degrading adsorption bed rather than a process upset.
Does under-regeneration really degrade a molecular sieve bed permanently?
Desorption is endothermic and roughly follows an Arrhenius relationship, so under-regeneration brings the bed back online with less free capacity than it left with, and that deficit compounds cycle after cycle. It is invisible on the effluent dew point for many weeks and shows up first as the slow capacity loss behind an O2 drift. Audit your regen temperature against the commissioning baseline before blaming the charge.
Which ASTM standards should I name in a molecular sieve purchase specification?
ASTM D4058 for attrition index, ASTM D2854 for apparent density, ASTM D2862 for particle size distribution and attrition of molecular sieve-type materials, ASTM D6185 for crushing strength of formed shapes, ASTM E300 for sample selection and chain-of-custody when sampling a live bed, and ISO 8573-1 for compressed air quality classes if the dry room is compressor-fed.
How do I distinguish bed capacity loss from a mechanical fault in one shift?
Trend differential pressure against O2 together. Rising O2 with stable differential pressure indicates capacity loss from displacement or under-regeneration. Rising O2 with rising differential pressure indicates dust generation, a blocked inlet filter, or water carryover from a failing upstream separator. O2 and RH rising together points to blower loss, damper failure, or the bed being bypassed entirely.
Does the particle size I choose affect dry room pressure drop and cell line cleanliness?
Yes. Dry rooms move large volumes at low pressure. Smaller pellets maximise kinetics but raise differential pressure and fan energy, and generate dust that can reach the cell line. Larger pellets drop pressure but slow the mass-transfer front. Typical industrial ranges are 1.6-2.5 mm and 2.5-3.5 mm, and you should specify your pressure-drop budget explicitly rather than accepting whatever the vendor ships.
How often should I run a laboratory breakthrough test on the charge?
At commissioning to establish a baseline, after every charge changeover to qualify the incoming lot, and whenever the effluent O2 or dew point trend departs from that baseline. A breakthrough test is the only measurement that separates a genuinely exhausted bed from a bed that is being operated badly, which is the distinction that determines whether you replace media or fix your regeneration procedure.
Does binder content really affect the true cost per cycle?
Yes. A binder improves crush strength and lowers attrition, but it is dead weight occupying adsorption volume. A charge with a high binder fraction can show an acceptable capacity figure on a certificate while delivering fewer effective cycles per cubic metre of vessel, which raises the real cost per cycle. Ask for loss on ignition and binder content explicitly, and compare it against the attrition index.
What should be in the purchase specification to get comparable offers?
State the grade and pore aperture, the dynamic working capacity with the test conditions attached, particle size distribution, bulk and apparent density, crush strength and attrition index to ASTM D4058, and loss on ignition with Na2O and binder content. Without test conditions on the capacity figure, two offers are simply not comparable, because dynamic capacity is measured at a defined temperature, pressure and loading.
Is nitrogen-purge dry room management actually cheaper than adsorbent-based O2 control?
It depends on volume and stack height. A nitrogen generator has high capital cost and consumes significant power, but it removes O2 by exclusion rather than by adsorption, so the adsorbent duty collapses to water only. For very large dry rooms or tall cleanrooms with high make-up rates, nitrogen is often more stable. For smaller electrode-filling areas, a properly sized 4A or 5A bed is usually the more economical route, provided you manage the regeneration properly.
How does temperature affect the O2 reading if my analyser is not temperature compensated?
Both analyser families are temperature sensitive. Paramagnetic analysers are typically specified with a compensated range, commonly around 20 to 50 degrees Celsius, and an uncompensated installation will drift as the analyser enclosure warms in a dry room that runs warm to protect the cells. If your O2 reading steps upward during the first hour after a shift start and settles afterwards, suspect analyser thermal stability rather than the adsorption bed.
Related AluminaWorld technical guides
- our companion guide to compressed air drying with activated alumina
- activated alumina versus molecular sieve for compressed air drying
- 4A molecular sieve for natural gas dehydration
- 13X bed saturation kinetics in a Haber-Bosch purge recovery loop
- adsorbent wheel desiccant cycle trade-offs in direct air capture
- PSA oxygen bed sizing and ten-year total cost of ownership
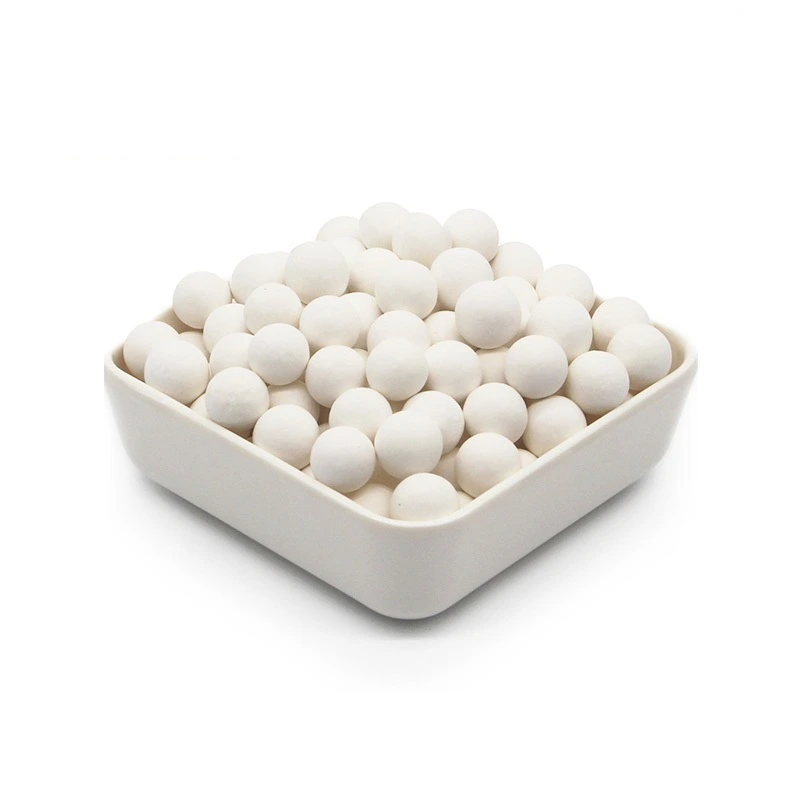
Activated Alumina (BET 300–360 m²/g)
Spherical and cylindrical grades for compressed-air drying, dry-room humidity control, and PSA feed preparation, supplied with COA and MSDS per lot.
View Product Details →Next Steps
If you are currently chasing an unexplained O2 drift in a battery dry room, the fastest path to a decision is a two-sample comparison: a laboratory breakthrough test on your current charge, and a technical datasheet from a supplier that states dynamic capacity with test conditions attached rather than a static number with no context. If you want a comparison sheet, send us your current grade, your working pressure, and your design flow rate and we will return a sizing recommendation with the pressure-drop budget included.
Talk to a technical engineer:
WhatsApp +86 133 2522 2240
Email barry@aluminaworld.com