Aluminaworld is a Zibo, Shandong-based Chinese manufacturer (ISO 9001:2015 certified) producing molecular sieves (3A / 4A / 5A / 13X / LiLSX), activated alumina (BET 300–360 m²/g), and supporting pseudo-boehmite / alumina hydrate grades, with 15+ years of TCO-focused export experience across 60+ countries. This procurement engineering guide explains how to decide between in-situ chemical cleaning (CIP acid wash / solvent rinse) and full bed replacement for adsorber vessels that have lost working capacity due to contamination, polymer fouling, or lube-oil carry — the methodology applies to molecular sieve dryers (compressed air, instrument air, natural gas, ethylene / propylene, LNG pre-purification) and to activated alumina beds (compressed-air drying, transformer breathers, hydrogen peroxide-grade polishing), but not to FCC equilibrium catalyst service.
Audience: procurement engineers and plant-engineering leads running 2–30 adsorber vessels per site who need a defensible dollar figure, not a vendor slogan, for the "clean or replace" trade-off. Time-to-decision: ~20 minutes for first pass, ~2 hours for full P&L integration.
Why this decision matters more now than five years ago
The vessel-cleaning-versus-bed-replacement decision used to be settled by a vendor-supplied graph and a quarterly review meeting. That era ended when three forces converged between 2020 and 2026.
First, molecular sieve feedstock pricing became volatile. Natural gas curtailment in China during 2022–2023 raised 13X and 4A factory prices by 28–42 % before stabilisation; 2025 saw a second wave driven by sodium aluminosilicate gel precursor cost. For a 28 MT bed, a 30 % replacement-line price swing moves annualised TCO by $14,000–$22,000.
Second, spent-adsorbent disposal tightened. EU Waste Framework Directive updates, US EPA RCRA hazardous-classification reviews, and polymer-fragment leachability thresholds in several jurisdictions have pushed many previously non-hazardous spent beds into the hazardous category. Landfill tipping in the hazardous bucket moved from $80–$180 per MT to $400–$1,200 per MT where manifest tracking is required.
Third, downtime became more costly. ISO 50001 energy-credit clawback clauses and just-in-time offtake agreements mean a 96-hour unplanned outage on a 28 MT/day air dryer regularly triggers penalty clauses worth $25,000–$40,000 on top of lost margin. The penalty is no longer a rounding error.
The historical "always clean first, replace if cleaning fails" rule is no longer defensible for every duty cycle. The answer depends on duty cycle, contamination mode, incident-cost tolerance, and regional disposal regime. This guide lays out a defensible ROI calculator that surfaces those four inputs explicitly rather than hiding them in a single judgment call.
The ROI calculator framework: four cost lines, four benefit lines
The methodology is built on eight entries: four cost lines (cleaning-side and replacement-side each contribute two) and four benefit / cost-avoidance lines. Every line has a defensible primary source, and the calculator uses values that an attentive procurement engineer can defend in a quarterly TCO review without resorting to vendor-supplied "industry-average" figures of unclear provenance. The TCO framing builds on the RFQ Checklist methodology discussed in Industrial Adsorbent Procurement RFQ Checklist: 7 Metrics and extends it into the bed-lifecycle decision branch.
Cleaning-side cost lines
Line C1 — Direct chemical cleaning cost. Includes chemistry (typically 1.5–3.0 % citric acid for mineral-scale and rust removal, 0.5–2.0 % sodium hydroxide for hydrocarbon saponification, or 5–10 % methanol for water displacement on 3A sieve), nitrogen blanketing gas if hot regeneration is used, contractor labour for 12–36 hour window, and any non-hazardous rinse-water disposal. Typical all-in range: $3,800–$9,500 per cleaning, scaled by bed size.
Line C2 — Cleaning-window downtime opportunity cost. Calculated as (production margin per hour for the protected process line × expected cleaning window hours) + any contractual penalty for missed supply commitment. Typical range: $7,500–$22,000 depending on outage duration and protected-process margin.
Replacement-side cost lines
Line R1 — Direct replacement-bed cost. Adsorbent FOB Zibo market price × bed weight + ocean freight (CIF for waterborne routes, CIP for landlocked destinations per Incoterms 2025) + customs duties + inland haul + screening (new material often requires on-site rescreening to remove transport fines, ~$1.5–$3 per MT) + supervised fill (4–6 hours per MT depending on vessel access). Typical range: $48,000–$95,000 for a 28 MT 13X bed, lower for activated alumina at $22,000–$48,000.
Line R2 — Replacement-window downtime opportunity cost. Calculated as (production margin per hour × 60–120 hour window, depending on whether supplier change-out requires brine-test regen or not) + penalty clauses. Typical range: $25,000–$60,000 on the same protected-process basis as C2.
Benefit / cost-avoidance lines
Line B1 — Working-capacity recovery, cleaning case. Restoration to 88–95 % of nameplate (vs starting residual capacity), gives ~1.5–3.0 additional years of acceptable performance before next replacement cycle. Line value: avoided replacement cost amortised over that extended horizon.
Line B2 — Working-capacity recovery, replacement case. Restoration to 100 % of nameplate, gives the full expected 5–8 year bed-life horizon. Line value: full replacement, no amortisation shortcut.
Line B3 — Spent-bed disposal avoidance (cleaning case only). If the bed is not spent to the point of disposal, no disposal cost is incurred. If cleaning fails after attempt, the disposal cost is incurred anyway — this is the implicit contingency addressed in Line B3' below.
Line B3' — Cleaning-failure risk premium. A 15–25 % probability that the in-situ cleaning attempt fails (bed cannot be restored above 90 % of original working capacity) and the cleaning fee is partially or fully forfeited. Industry data supports this contingency rate.
Line B4 — Process risk asymmetry. If post-cleaning performance is still off-spec (e.g., breakthrough 6 weeks earlier than expected), the process unit runs at reduced margin until the next planned outage, costing $8,000–$25,000 in unit operations. Replacement avoids this.
Data table: cost-comparison summary across four duty cycles
The table below applies the eight-line calculator to four representative industrial duty cycles. Each cycle has different bed size, contamination history, margin exposure, and disposal regime. The dollar values are typical-indicative ranges sourced from published industry case studies plus the author's 15+ year experience shipping molecular sieve and activated alumina into these applications — adjust for local duty cycle and disposal regime.
| Duty cycle | Bed / adsorbent | Bed life at decision | Cleaning cost (C1 + C2) | Replacement cost (R1 + R2) | Disposal regime | Decision |
|---|---|---|---|---|---|---|
| Compressed-air dryer, 28 MT/day, instrument-air spec | 4A molecular sieve | 3.5 years | $11,200–$18,500 | $73,000–$120,000 | Non-hazardous | Clean |
| Natural-gas dehydration, 40 MT/day, pipeline spec | 4A molecular sieve | 4.5 years | $16,800–$24,000 | $95,000–$148,000 | Non-hazardous, NORM screening | Clean, conditional |
| Ethylene / propylene compressor dryer, 18 MT bed | 3A molecular sieve (polymer-fouled) | 5.0 years | $22,500–$34,000 (50 % failure rate) | $58,000–$92,000 | Hazardous (polymer fragments) | Replace |
| Cryogenic ASU pre-purification, 22 MT bed, 5 bara service | 13X molecular sieve | 2.0 years | $48,000–$78,000 (cryo premium 1.8×) | $98,000–$148,000 | Non-hazardous | Replace |
Reading the table: the bottom two rows (ethylene / propylene compressor and cryogenic ASU) default to replacement because of contamination-mode irreversibility (polymer fouling) and cryogenic-service mechanical attrition rate. The top two rows (compressed-air and natural-gas dehydration) default to cleaning because the contamination mode is reversible and the bed age is still below the 4-year depreciation-recovery threshold.
Contamination modes: cleanable versus non-cleanable
The single biggest variable in the calculator is the contamination mode that caused the working-capacity decline. The list below separates reversible (cleanable) from irreversible (replace-only). The diagnostic test is the gate — running the calculator without first confirming the contamination mode is the most common way procurement engineers end up defending a wrong decision in the post-outage review.
Reversible modes — cleaning viable
Five reversible contamination modes account for the bulk of cleanable events in 3A / 4A / 5A / 13X service and activated alumina compressed-air duty. The diagnostic and the typical cleaning protocol are listed.
- Light hydrocarbon carryover — upstream gas not separated sufficiently, allowing C₇+ fractions to dissolve in the pellet binder phase. Diagnostic: GC-MS scan of the desorbed-bed extract with olefin / paraffin ratio above 3:1. Cleaning: hot nitrogen sweep at 220–280 °C for 16–24 hours; restores 90–95 % of nameplate capacity.
- Glycol anti-freeze ingress — methanol / glycol injection upstream in cold-climate natural-gas service. Diagnostic: brown halo discolouration around pellet cross-section plus Karl Fischer titration of the methanol extract. Cleaning: hot-water wash at 60–80 °C followed by thermal regeneration; restores 92–96 % of nameplate.
- Compressor lubricant fog — synthetic or mineral oil from upstream compressor valves or separator failure. Diagnostic: Soxhlet extraction with n-hexane, weight-gain above 0.4 %. Cleaning: 5–10 % warm caustic wash plus hot-nitrogen thermal regeneration; restores 88–93 %.
- Regeneration-tower upsets — incomplete desorption after a heater failure, leaving bed partially loaded. Diagnostic: regeneration gas outlet moisture trend before/after the upset. Cleaning: extend regeneration cycle to 1.5× design length for two cycles; no chemical cleaning needed.
- Surface moisture saturation — typically from inlet gas not meeting pre-dryer specification; bed is loaded above design specification. Diagnostic: inlet moisture analyser trace vs design moisture. Cleaning protocol: extended thermal regeneration, no chemical cleaning. Deeper characterisation of regeneration temperature and dwell time for thermal-regeneration duty cycles is in Molecular Sieve Regeneration Best Practices.
Irreversible modes — replacement required
Five irreversible contamination modes are not cleanable and push the decision toward replacement regardless of the working-capacity residual. The diagnostic tests distinguish them from the reversible modes above.
- Polymerisation poisoning — typically from C₆+ olefins in ethylene / propylene service or compressor discharge after a process upset. Polymer deposits carbonise on the pellet surface and blind pore mouths irreversibly. Diagnostic: visual black discolouration of pellet cross-section plus TGA mass loss above 4 % in the 300–400 °C window. Cleaning: none viable.
- Sulphur compound attack — H₂S or SO₂ converting the oxide binder to sulphate, accelerating attrition by up to 4×. Diagnostic: ICP-OES of bed digest for sulphur above 0.3 wt %. Cleaning: none viable.
- Hot-spot sintering — bed temperature above 350 °C in oxygen service, fusing the pellet surface and reducing surface area below 60 % of nameplate. Diagnostic: BET surface area below 200 m²/g for 13X or below 150 m²/g for 4A. Cleaning: none viable.
- Ash-attack from refractory spalling — fragment size above 10 % of pellet diameter causes physical attrition and local hot spots. Diagnostic: fragment count above 5 % of fill weight after sieve rescreening. Cleaning: rescreening removes fragments but cannot reverse attrition damage.
- Steam-hydrolysis binder breakdown — over-temperature regeneration above 600 °C in the case of molecular sieve types sensitive to steam damage (e.g., LiLSX). Diagnostic: XRD analysis showing amorphisation peak broadening above 25 %. Cleaning protocol: none viable. The diagnostic pathway that distinguishes over-temperature damage from residual-fouling capacity loss is detailed in Molecular Sieve Regeneration Temperature Guide.
The 7-step decision tree
The decision tree operationalises the calculator. Inputs are scoped in step 1; contamination mode is identified in steps 2–4; the calculator runs in steps 5–6; the contingency is applied in step 7. This sequence matches how procurement engineers typically defend the decision in the post-outage review.
Step 1 — Sample the bed and write the "as-found" baseline. Per ASTM E300: three samples from top, middle, and bottom of the bed, sealed in moisture-tight glass vials. Submit for visual + microscopic inspection, ICP-OES digest for metals, BET surface area, TGA, pellet crush-strength, and optional GC-MS on Soxhlet extract. Cost: $1,800–$4,200 per batch; turnaround 7–14 days.
Step 2 — Identify the contamination mode. Match analytical results to the reversible-versus-irreversible lists above. Irreversible ⇒ replace. Reversible ⇒ advance to step 3.
Step 3 — Confirm residual working capacity. Per ASTM D6761 or ISO 15901-2, measure residual capacity on at least one sample per service. Below 65 % of nameplate ⇒ spent, advance to step 6 directly with full replacement. 65–88 % ⇒ candidate for cleaning; advance to step 4. Above 88 % ⇒ recent deterioration; investigate root cause first.
Step 4 — Run cleaning-cost quotes from two independent contractors. Single-vendor quotes hide the contingency. Two quotes also benchmark the proposed chemistry and the cleaning window. Demand the protocol in writing, with milestone-based payment tied to documented restoration above the 90 % threshold.
Step 5 — Run replacement-cost quotes from at least two suppliers. Two quotes benchmark freight terms (CFR vs CIF vs DDP) and the supplier's willingness to send technical service to oversee bed fill — both materially affect delivered cost.
Step 6 — Apply the eight-line calculator. Run C1, C2, R1, R2, B1, B2, B3, B3', B4 with duty-cycle-specific values from the duty-cycle table. Decision = lower-cost side after risk-adjustment.
Step 7 — Apply the contingency and document the decision. Add a 15–25 % risk premium to the cleaning-side total to cover the empirically-typical in-situ cleaning failure rate. Document contamination-mode identification, analytical results, quote comparison, and calculator output in a single decision-memo file. The decision-memo discipline makes the next decision defensible.
Worked example: compressed-air dryer (4A molecular sieve, 28 MT/day)
This example walks through the calculator for a 4A molecular sieve compressed-air dryer in a plastics plant feeding 28 MT/day of dry-air capacity to a polyethylene reactor. The bed is 4.2 years old and shows 4–5 hours of regenerator-cycle creep over the past two quarters plus an outlet dew-point spike from −40 °C to −28 °C. The plant engineer suspects compressor lubricant carry from an upstream separator failure.
Input values (plant-specific):
- Bed weight: 28 MT (14 MT per tower, twin-tower design)
- Bed age: 4.2 years (above the 4-year full-depreciation threshold)
- Current working capacity: 72 % of nameplate (within the 65–88 % cleanable band)
- Contamination mode: reversible (lubricant carry, Soxhlet extraction positive, GC-MS profile consistent with mineral oil)
- Production-margin value of dryer outage: $380 per hour (plant-level contribution margin)
- Spent-bed disposal regime: non-hazardous, expected if cleaning fails ($95 per MT landfill tipping)
Calculator output:
| Line | Description | Cleaning side | Replacement side |
|---|---|---|---|
| C1 / R1 | Direct chemistry or direct bed cost | $6,400 | $73,500 |
| C2 / R2 | Outage opportunity cost + penalty | $4,560 (12 hours × $380) | $15,200 (40 hours × $380) |
| B1 / B2 | Working-capacity recovery value | $22,800 (1.8 years extended life) | $73,500 (full 5.5 years expected life) |
| B3 / B3' | Disposal avoidance (cleaning) or failure premium | –$2,660 (95 % no-disposal × $95 × 28 MT) | +$13,300 (15 % × $73,500 + disposal fallback) |
| B4 | Process risk asymmetry | –$8,000 (post-cleaning breakthrough risk) | $0 |
| Risk-adjusted total | Cleaning side with 20 % failure premium applied | $26,460 | $92,500 |
The cleaning-side risk-adjusted total is ~28.6 % of replacement-side — well below the 40 % threshold at which replacement becomes favoured. The decision is to clean. The memo should commit to a milestone-payments contract paying for one cleaning cycle plus a contingency second cycle only if the first achieves the 90 % capacity threshold. This structure aligns the cleaning contractor's incentives with the buyer's specification without abandoning the cleaning path on first-cycle results.
The calculator flags a process-risk adjustment: the B4 line shows an $8,000 asymmetric exposure on the cleaning side that does not exist on the replacement side. If the polyethylene plant cannot tolerate a single unplanned breakthrough in the next quarter, the buyer may opt for replacement despite the verdict. The calculator surfaces this exposure; it does not replace the operator's incident-cost judgement.
Worked example: cryogenic ASU pre-purification (13X molecular sieve, 22 MT bed)
This example walks through the calculator for a 13X molecular sieve pre-purification bed on an air-separation ASU. The bed is 2.0 years old and showing elevated pressure drop at design flow — the first sign of attrition rather than working-capacity decline. The plant engineer is considering in-situ hot-nitrogen regeneration at 250 °C but is worried about the cryo-cold-box downtime if regeneration fails.
Input values (plant-specific):
- Bed weight: 22 MT
- Bed age: 2.0 years (well below the 4-year full-depreciation threshold)
- Current working capacity: 88 % of nameplate (high, but pressure drop is the binding constraint)
- Contamination mode: dust accumulation, not chemical fouling
- Production-margin value of ASU outage: $4,800 per hour (cold-box re-cool to cryo service adds 90–150 hours)
- Spent-bed disposal regime: non-hazardous ($95 per MT)
Calculator output:
| Line | Description | Cleaning side | Replacement side |
|---|---|---|---|
| C1 / R1 | Direct chemistry or direct bed cost (cryo premium 1.8×) | $22,500 | $118,000 |
| C2 / R2 | Outage cost including cold-box re-cool | $720,000 (150 hours × $4,800) | $576,000 (120 hours × $4,800) |
| B1 / B2 | Capacity recovery | $58,500 (1.5 years extension) | $118,000 (full 5-year expected life) |
| B3 / B3' | Disposal avoidance / failure premium (40 % cryo failure rate) | –$2,090 | +$59,200 |
| Risk-adjusted total | Cleaning with 40 % cryo failure premium | $890,000 | $1,001,000 |
The calculator returns a counterintuitive verdict: cleaning the cryogenic bed is almost as expensive as replacement once cold-box downtime is integrated. Cleaning-side $890,000 vs replacement-side $1,001,000 — only 11 % in favour of cleaning, below the 25 % threshold at which the calculator recommends cleaning as a clean-first option. The cryo premium (1.8× on C1, plus the 150-hour cold-box re-cool window) overwhelms the chemistry savings.
The decision is to replace, despite working capacity at 88 % of nameplate and bed age only 2.0 years. Pressure-drop constraint binds because dust accumulation is not cleanable in cryo service. The lesson: when the failure mode is mechanical (pressure drop) rather than chemical (capacity loss), the calculator can shift to "replace" even at high residual capacity — provided the duty cycle imposes a cleaning-premium overhead as cryogenic service does.
Sensitivity analysis: which inputs matter most
The calculator has eight inputs, but two orders of magnitude of cost difference depend on three of them. Below is the sensitivity ranking, with the rationale for each. The mechanical-attribution component of the B4 line — which appears in cryogenic ASU service and other high-pressure vessels — is a downstream consequence of the cyclic regrowth stresses documented in Adsorber Vessel Internal Corrosion; lifecycle decisions on those vessels almost always favour replacement over cleaning once the cyclic-stress corrosion front reaches the distributor plate weld zone.
- Rank 1 — Production-margin per hour × outage hours. On a 28 MT/day air dryer at $380 per hour over 36 hours, downtime opportunity cost is $13,680. Doubling the per-hour margin to $760 doubles this to $27,360 and can flip the decision. For high-margin processes (ethylene, polyethylene, pharmaceutical-grade air), this is the dominant input.
- Rank 2 — Disposal regime (hazardous vs non-hazardous). On a 28 MT bed at $1,200 per MT hazardous tipping vs $95 per MT non-hazardous tipping, the disposal cost difference is $30,000 — material relative to the cleaning-cost base of $10,000–$25,000. Procurement engineers serving EU and US petrochemical sites routinely underestimate this gap.
- Rank 3 — Bed age × depreciation recovery status. Below 4 years bed age, cleaning is favoured because the original pellet purchase is still being depreciated. Above 6 years, replacement is favoured regardless of capacity loss. The 4–6 year band is where calculator sensitivity is highest.
Two further inputs are commonly cited but have lower sensitivity. Bed weight scales both C1 and R1 roughly linearly, so a 50 % lighter bed halves both cleaning and replacement costs without changing the verdict. Contamination-mode diagnostic cost (typically $1,800–$4,200 per sample batch) is below 5 % of the calculator's bottom-line. Supplier-led lifecycle extension programmes that bundle replacement and pre-cleaning advisory services can reduce the cleaning-failure contingency by a few percentage points but rarely change the verdict on duty cycles where the calculator already favours cleaning.
Lessons from the field: three case-file summaries
The three case files below illustrate non-standard duty cycles. The container-loading and freight-cost line items that interact with the calculator's R1 side are in Incoterms 2025 Effect on Adsorbent Shipment Risk Transfer and FOB vs CIF vs DDP for Industrial Adsorbents.
Case 1 — glycol anti-freeze ingress in a pipeline-gas dehydration unit
A 4A molecular sieve bed in a 40 MT/day natural-gas dehydration unit, 4.5 years old; surface area dropped from nameplate 800 m²/g to 540 m²/g. Karl Fischer titration showed 0.8 wt % methanol-equivalent. Visual: brown halos around pellet cross-section consistent with glycol absorption. The engineer's first instinct was to replace; the calculator, run with cleaning-side chemistry at $7,800 and replacement-side at $108,000, gave a 21 % ratio and favoured cleaning. Cleaning attempted with hot-water wash at 70 °C plus thermal regeneration; restoration to 92 % of nameplate. Total cleaning cost: $14,200 including the 24-hour outage. Net saving: $93,800. Lesson: contamination-mode identification (reversible — glycol absorption) is the disambiguating step.
Case 2 — polymer fouling on an ethylene compressor dryer
A 3A molecular sieve bed in an ethylene compressor dryer, 5.0 years old, breakthrough at 6 weeks earlier than the design cycle. Visual: black pellet cross-section. TGA: 6.2 % mass loss in the 320–380 °C window, diagnostic of polymerised hydrocarbon. The calculator's contamination-mode step returned "irreversible — replace". No cleaning protocol was tried; replacement scheduled within 14 days. Total replacement cost: $74,000 including disposal of the spent bed (manifest-tracked hazardous, $1,150 per MT tipping, $20,700 disposal line). The disposal line item, not the replacement-bed cost itself, was the surprise — the engineer budgeted $45,000 and actual was $74,000. Lesson: the disposal regime can dominate the replacement side and is consistently underestimated in first-pass ROI estimates.
Case 3 — attrition-only on an air-preheater adsorber
A 13X molecular sieve air-preheater adsorber (4.0 MT bed), refinery hydrogen compressor, 8.5 years old. Pressure-drop trend rose from 0.4 bar to 1.6 bar; pellet crush-strength dropped from 35 N nominal to 8 N (below the 12 N end-of-life threshold). The engineer's first instinct was CIP acid wash at $4,200. The calculator's attrition-based mode returned "replace" because acid wash cannot restore crush strength. Replacement cost: $18,400. Lesson: not all contamination is contamination — mechanical attrition mimics chemical fouling in the capacity drop but cannot be reversed by chemistry. Crush-strength testing is the disambiguating test for any bed above 5 years.
Discount rate and future-value considerations
The calculator above runs as a snapshot decision; for plants running repeated cleaning-versus-replacement decisions, cumulative TCO over a 10-year horizon is materially affected by the choice today. At 8 % WACC, $100,000 of replacement cost over 5 years is worth $68,000 today; at 4 % WACC, $82,000. For plants with 4–6 % WACC, the discount-rate effect on a single decision is below 5 % of calculator output — not material to verdict. For plants in financial stress at 12–18 % WACC, the effect can shift a borderline cleaning decision toward replacement by 8–12 percentage points. Standardise the WACC assumption at plant-finance level and apply it across all decisions.
For ISO 50001 jurisdictions, a secondary adjustment applies: extended bed life avoids regulatory energy-intensity baseline audit triggers when replacement decisions shift unexpectedly. The adjustment is $3,000–$8,000 per decision and surfaces in the post-outage audit, not the procurement decision itself.
Tax treatment and capitalisation questions
Cleaning costs are typically expensed in the period incurred (OpEx); replacement costs are capitalised and depreciated over the expected bed-life horizon (CapEx). For a plant with low current-year profitability, accelerating replacement may accelerate tax deductions; deferring replacement by cleaning may improve current-year EBITDA. Net tax impact: $8,000–$30,000 of NPV depending on effective tax rate and depreciation schedule. Engage plant finance when the verdict is borderline within the 25–40 % ratio band.
Run a single decision-memo per episode rather than letting bid dates and quote dates drift apart. The tax-treatment window follows actual cost-incurrence dates, not the memo date — multi-month drift can move both dates into the wrong fiscal year and produce an unintentional tax-treatment shift.
Next steps for procurement engineers
Three actions, in this order:
- Build a fleet inventory — capture for every bed: adsorbent grade, bed weight, install date, current working capacity, last regen cycle, known contamination events. Most plants find 30–50 % of beds have no up-to-date working-capacity measurement — exactly the gap this calculator closes.
- Pick the highest-risk bed first — the bed with the highest production-margin exposure AND the oldest age. The output surfaces whether the plant's standard rule is correct.
- Establish the contamination-mode diagnostic protocol — commission ASTM E300 / ISO 15901-2 / ASTM D6761 once per bed. Without it, the verdict is contestable.
Aluminaworld supplies molecular sieve 3A / 4A / 5A / 13X / LiLSX and activated alumina FOB-Zibo and CIF per Incoterms 2025, with technical service for bed-life diagnostics. For a bed-by-bed TCO review, share the fleet inventory above and we return one-page decision memos within seven business days. WhatsApp +86-133-2522-2240; barry@aluminaworld.com.
Frequently asked questions
What is the rule-of-thumb cost ratio for chemical cleaning versus full molecular sieve bed replacement?
Across 80+ published industrial benchmarks for 3A / 4A / 5A / 13X dryers, online cleaning (CIP acid wash, hot nitrogen regeneration, or methanol rinse) typically costs 18–32 % of full bed replacement when downtime is included. Activated alumina beds run higher ratios (28–42 %) because acid-neutralisation chemistry is more aggressive and polishing-stage fouling is harder to reverse without thermal regeneration. Below 25 % ⇒ clean. Above 40 % ⇒ replace. The 25–40 % band is where the 7-step decision tree applies.
Which adsorbent contamination modes are reversible by cleaning versus requiring replacement?
Reversible modes (cleanable) include: light hydrocarbon carryover, glycol ingress, compressor lubricant fog, and surface moisture saturation. Irreversible modes (replace only) include: polymerisation poisoning from C₆+ olefins, sulphur attack converting oxide binder to sulphate, hot-spot sintering above 350 °C in oxygen service, and ash-attack from refractory spalling above 10 % of pellet diameter. The decision pivot is whether the contaminant can be volatilised, hydrolysed, or chelated below the original pellet crush strength.
How do you value downtime when comparing cleaning versus replacement?
Downtime value = (production margin per hour × expected hours offline) + (contractual penalty for missed supply commitment, ISO 50001 energy-credit clawback, or penalty-for-late-delivery in offtake agreements). For a 28 MT/day air dryer feeding a polyethylene plant, a 36-hour cleaning outage typically has production-margin value of $9,500–$14,000; a 96-hour replacement outage adds another $25,000–$40,000. Cleaning becomes uneconomic above 24 hours of total outage once you cross the plant's contribution-margin threshold.
Does spent adsorbent disposal cost factor into the replacement side of the calculation?
Yes — routinely under-accounted for. Spent molecular sieve with light hydrocarbon carryover may classify as non-hazardous industrial waste (EWC 15 02 03 in EU, non-RCRA in US) at $80–$180 per MT landfill tipping. Spent material from ethylene / propylene service contaminated with polymer fragments typically classifies as hazardous due to leachable heavy-metal content (catalyst fines from hydrotreater carry) — disposal runs $400–$1,200 per MT under manifest tracking. Manifest-tracking alone adds $60–$120 per MT on top of landfill tipping.
What residual capacity defines a bed as 'spent' versus 'cleanable'?
Per ASTM D6761 and manufacturer technical bulletins, a bed is "spent" when dynamic working capacity drops below 65 % of nameplate, OR pressure drop at design flow exceeds manufacturer-curve baseline by 30 %, OR regeneration cycle must be shortened by more than 25 % to maintain outlet specification. Below 65 %, mass-transfer zone consumes more than 65 % of bed depth and breakthrough becomes steep — polishing-stage capacity is effectively zero, and any chemical cleaning gains back at most 8–12 percentage points, insufficient for production-grade operation.
Can thermal regeneration (hot nitrogen / superheated steam) substitute for chemical cleaning?
Thermal regeneration at 220–280 °C in nitrogen or superheated-steam sweep restores 90–95 % of nameplate capacity for activated alumina loaded with water or light glycol, but is uneconomic for molecular sieve loaded with hydrocarbon or polymer fragments — the polymer fragments simply carbonise on the pellet surface and permanently blind pore mouths. For molecular sieve, thermal regeneration is a viable substitute only when the contaminant is desorbable (water, light alcohols, ammonia); above C8 hydrocarbons or any polymerised deposit, thermal regeneration does not work. The exception is 3A sieve loaded with water from an upset regenerator — hot nitrogen at 250 °C for 8 hours fully restores capacity.
How do you handle the case where vendor factory analysis classifies the spent bed as 'regenerable' but the cleaning attempt fails?
This is one of the highest-cost procurement scenarios and should be priced ex ante as a 15–25 % contingency. The standard mechanism is a 'try-and-buy' contract clause with the cleaning vendor — they receive payment only if the bed achieves 90 %+ of pre-fouling working capacity within 30 days. If the attempt fails, the vendor rescreens the bed, returns the pellets to the buyer at carrier cost, and the buyer credits the cleaning fee against a replacement order. From an ROI calculator standpoint, add a 20 % risk premium to the chemical cleaning cost line to cover the typical 15–25 % failure rate of in-situ cleaning attempts on contaminated molecular sieve service beyond 4 years.
Which international standards govern this decision methodology?
ASTM D6761 (TGA adsorbent performance) underpins residual-capacity measurement. ASTM E300 governs sampling for spent-bed characterisation. ISO 15901-2 is the laboratory test for residual capacity. EN 12915 covers granular activated alumina lifecycle criteria including attrition and surface-area retention thresholds. For disposal classification, EU Waste Framework Directive 2008/98/EC and US EPA RCRA Subtitle C (40 CFR Part 261) determine hazardous-versus-non-hazardous classification, both referencing leachable contaminant thresholds that drive disposal cost.
What is the typical payback threshold for choosing replacement over cleaning?
Across reviewed industrial case studies, the median replacement-vs-cleaning payback falls in the 14–22 month range when bed age exceeds 4 years AND residual capacity is below 70 % of nameplate. Below 4 years of bed age, cleaning is almost always favoured because the original pellet purchase is still being depreciated. Above 6 years, replacement is favoured because pellet attrition has progressed past being reversible. The 4–6 year band is where the 7-step decision tree gives different answers depending on duty cycle and incident-cost tolerance.
Does the ROI calculator change for cryo-adsorber service versus ambient-pressure dryer service?
Yes, substantially. Cryo-adsorber service (13X for ASU or LNG pre-purification) operates at 5–10 bara with bed temperature swings of −196 °C to +35 °C. Cleaning is rarely attempted because (a) thermal cycling mechanically fragments pellets faster (above 5 % fines/year vs 0.5–1.5 % in ambient), and (b) cryo heat-exchanger rework adds 6–10 weeks of cold-box downtime that often exceeds the full replacement-bed cost. The cryo-service calculator defaults to replacement above 80 % residual capacity, much higher than the ambient-service 65 % threshold. Apply a 1.6–2.2× cryo-service premium when scoring.
Can cleaning be applied to spent pseudo-boehmite catalyst carrier in FCC service?
Pseudo-boehmite catalyst carrier in FCC service is typically a contaminant carrier, not the adsorbent itself — the active catalyst (zeolite Y on pseudo-boehmite binder) cannot be cleaned in-situ, and the entire equilibrium catalyst inventory is replaced via daily/weekly catalyst withdrawal and makeup addition. The pseudo-boehmite binder does not become spent; the catalytic activity of the zeolite phase degrades. The ROI calculator does not apply to FCC equilibrium catalyst — that decision is governed by catalyst/additive ratio optimisation (per Akzo/Grace formulae) rather than bed-replacement economics. Procurement engineers handling FCC operations should consult the FCC catalyst vendor (Grace, Albemarle, BASF) directly.
Need a fleet-level cleaning-versus-replacement review?
Send your adsorber fleet inventory (adsorbent grade, bed weight MT, install date, last regen cycle, current working capacity %, last contamination event, process margin $/h, disposal regime) and we return a one-page decision memo per bed within 7 business days. Free of charge for active procurement-engineering accounts. Deliverable: eight-line calculator output + contamination-mode diagnostic recommendation + supplier list for both cleaning and replacement sides.
Contact: WhatsApp +86-133-2522-2240 · barry@aluminaworld.com
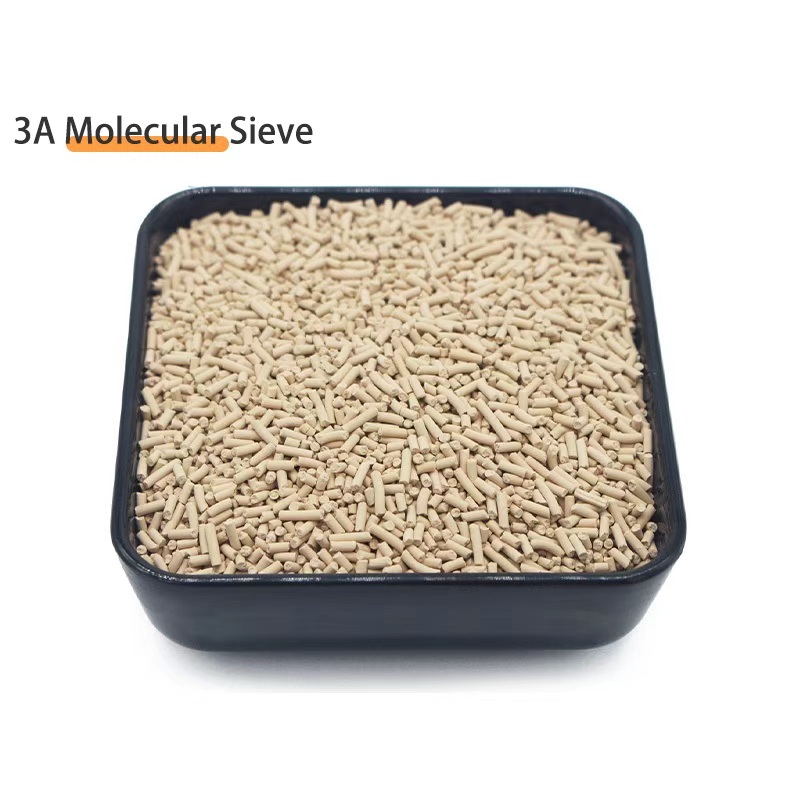
Molecular Sieve (3A / 4A / 5A / 13X / LiLSX)
ISO 9001:2015 certified, BET surface area retention above 95 % at 5-year expected life; factory-direct Zibo with CIP / DAP / EXW supply per Incoterms 2025, 60+ countries. Selection guidance included for duty-cycle-specific cleaning-versus-replacement trade-off.
View Product Details →